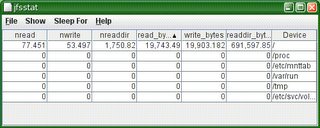
I left it running looking at file accesses - lookup, access, pathconf, readlink - and started to notice some odd patterns.
The first was that /proc was getting a very steady 25 lookups and 12.5 accesses per second. OK, that's easy - I had top running (refreshing every 5 seconds) and this system has 60 processes on it, so every refresh top is doing 1 access and 2 lookup per process.
The next was that / (and this machine just has the single filesystem) was seeing about 600 lookup and 10 access requests every 10 seconds.
The third part of the pattern was that roughly every minute there was a veritable storm of operations on the / filesystem.
Now, one of the longer term aims of my writing tools like jfsstat and jkstat is that you see some strange activity, and you can click on the activity there and then and drill down deeper - probably with dtrace. I'm not there yet, but I thought I would practice my dtrace skills and do it by hand.
OK, so what I'm after is ufs lookups. What can dtrace give me?
% dtrace -l | grep ufs| grep lookup
  536     vtrace               ufs                        ufs_lookup TR_UFS_LOOKUP_END
  537     vtrace               ufs                        ufs_lookup TR_UFS_LOOKUP_START
17836        fbt               ufs                        ufs_lookup entry
17837        fbt               ufs                        ufs_lookup return
Right. Let's have a look at what's generating those lookup requests:
% dtrace -n 'fbt:ufs:ufs_lookup:entry{@[execname]=count();}'
dtrace: description 'fbt:ufs:ufs_lookup:entry' matched 1 probe
^C

  java                                                            612
So, that 10 second repeating burst of 600 lookups is java. In fact, I know this to be tomcat.
Now I run the script again to catch the massive burst of activity that happens every minute:
% dtrace -n 'fbt:ufs:ufs_lookup:entry{@[execname]=count();}'
dtrace: description 'fbt:ufs:ufs_lookup:entry' matched 1 probe
^C

  sched                                                            24
  pwd                                                              28
  sh                                                               75
  fping                                                            91
  server.sh                                                       112
  uname                                                           150
  mysqld                                                          162
  ping.sh                                                         238
  nscd                                                            491
  cron                                                            498
  init                                                            988
  load.sh                                                        1014
  rup                                                            1539
  java                                                           1836
  perl                                                           2120
  awk                                                            2394
  mysql                                                         63666
I've hit the tomcat activity burst 3 times, but the once a minute is coming from something launched by cron - a system monitoring script that runs fping and rup and pokes the results back into a mysql database. But what on earth is mysql doing making 63666 lookup requests?
(The first question I asked was - is this one instance of mysql or many? If I aggregate on pid as well as execname then I see that I'm running a lot of copies of mysql, each of which generates 786 lookup requests on the filesystem.)
Next question: what are the pathnames that are being used in the lookup request? To get this, I need to understand the ufs_lookup call itself in a little more detail. So the source tells us that the 4th argument is a struct pathname, and the string I'm after is the pn_buf member. So let's see what pathnames are being looked up. First the little tomcat burst:
dtrace -n 'fbt:ufs:ufs_lookup:entry{@[stringof(args[3]->pn_buf)]=count();}'
dtrace: description 'fbt:ufs:ufs_lookup:entry' matched 1 probe
^C

  /opt/XSload/tomcat/conf/Catalina/localhost                        6
  /opt/XSload/tomcat/webapps/ROOT/META-INF/context.xml                6
  /opt/XSload/tomcat/webapps/jsp-examples/META-INF/context.xml                6
...
  /opt/XSload/tomcat/webapps/xsload/WEB-INF                        18
  /opt/XSload/tomcat/webapps/xsload.war                            20
  /opt/XSload/tomcat/conf/Catalina/localhost/host-manager.xml               35
  /opt/XSload/tomcat/conf/Catalina/localhost/manager.xml               35
  /opt/XSload/tomcat/webapps/balancer/META-INF/context.xml               35
  /opt/XSload/tomcat/conf/context.xml                              90
Pretty clear, really - every 10 seconds tomcat goes round checking to see if you've gone and modified anything.
Now for the mysql burst. What are the pathnames here? There's quite a lot of output, so I've trimmed it a bit:
...
  /usr/ccs/lib/libc.so.1                                          432
  /usr/ccs/lib/libcrypt_i.so.1                                    432
  /usr/ccs/lib/libcurses.so.1                                     432
  /usr/ccs/lib/libgen.so.1                                        432
  /usr/ccs/lib/libm.so.1                                          432
  /usr/ccs/lib/libnsl.so.1                                        432
  /usr/ccs/lib/librt.so.1                                         432
  /usr/ccs/lib/libsocket.so.1                                     432
  /usr/ccs/lib/libthread.so.1                                     432
  /usr/ccs/lib/libw.so.1                                          432
  /usr/ccs/lib/libz.so.1                                          432
  /lib/ld.so.1                                                    504
  /opt/SUNWspro/lib/rw7/libCrun.so.1                              540
  /opt/SUNWspro/lib/rw7/libCstd.so.1                              540
  /opt/SUNWspro/lib/rw7/libc.so.1                                 540
  /opt/SUNWspro/lib/rw7/libcrypt_i.so.1                           540
  /opt/SUNWspro/lib/rw7/libcurses.so.1                            540
  /opt/SUNWspro/lib/rw7/libgen.so.1                               540
  /opt/SUNWspro/lib/rw7/libm.so.1                                 540
  /opt/SUNWspro/lib/rw7/libnsl.so.1                               540
  /opt/SUNWspro/lib/rw7/librt.so.1                                540
  /opt/SUNWspro/lib/rw7/libsocket.so.1                            540
  /opt/SUNWspro/lib/rw7/libthread.so.1                            540
  /opt/SUNWspro/lib/rw7/libw.so.1                                 540
  /opt/SUNWspro/lib/rw7/libz.so.1                                 540
  /opt/SUNWspro/lib/v8/libCrun.so.1                               540
  /opt/SUNWspro/lib/v8/libCstd.so.1                               540
  /usr/local/mysql/data/my.cnf                                    540
...
  /opt/SUNWspro/prod/usr/lib/cpu/sparcv8plus+vis/libCstd_isa.so.1              756
  /opt/SUNWspro/prod/usr/lib/cpu/sparcv8plus+vis2/libCstd_isa.so.1              756
  /opt/SUNWspro/prod/usr/lib/cpu/sparcv9+vis/libCstd_isa.so.1              756
  /opt/SUNWspro/prod/usr/lib/cpu/sparcv9+vis2/libCstd_isa.so.1              756
  /opt/SUNWspro/prod/usr/lib/cpu/sparcv9/libCstd_isa.so.1              756
...
  /opt/SUNWspro/lib/libthread.so.1                                864
  /opt/SUNWspro/lib/libw.so.1                                     864
  /opt/SUNWspro/lib/libz.so.1                                     864
  /lib/libm.so.2                                                  888
  /usr/lib/libc.so.1                                              972
  /usr/lib/libcrypt_i.so.1                                        972
...
  /opt/SUNWspro/lib/v8/libgen.so.1                               1080
  /opt/SUNWspro/lib/v8/libm.so.1                                 1080
  /opt/SUNWspro/lib/v8/libnsl.so.1                               1080
  /opt/SUNWspro/lib/v8/librt.so.1                                1080
  /opt/SUNWspro/lib/v8/libsocket.so.1                            1080
  /opt/SUNWspro/lib/v8/libthread.so.1                            1080
...
  /opt/SUNWspro/prod/usr/lib/cpu/sparcv8plus/../../libCrun.so.1             2160
  /opt/SUNWspro/prod/usr/lib/cpu/sparcv8plus/libCstd_isa.so.1             2592
  /platform/SUNW,Sun-Blade-1000/lib/../../sun4u-us3/lib/libc_psr.so.1             3360
  /platform/SUNW,Sun-Blade-1000/lib/libc_psr.so.1                4480
What on earth?
So, most of these lookup operations are the mysql binary looking for shared libraries when it starts. And in some less than obvious places too! So why is this? I go and have a look at the binary:
% dump -Lv mysql
[INDEX] Tag         Value
[1]     NEEDED          libcurses.so.1
[2]     NEEDED          libz.so.1
[3]     NEEDED          librt.so.1
[4]     NEEDED          libcrypt_i.so.1
[5]     NEEDED          libgen.so.1
[6]     NEEDED          libsocket.so.1
[7]     NEEDED          libnsl.so.1
[8]     NEEDED          libm.so.1
[9]     NEEDED          libCstd.so.1
[10]    NEEDED          libCrun.so.1
[11]    NEEDED          libw.so.1
[12]    NEEDED          libthread.so.1
[13]    NEEDED          libc.so.1
[16]    RUNPATH         /opt/SUNWspro/lib/rw7:/opt/SUNWspro/lib/v8:/opt/SUNWspro/lib:/opt/SUNWspro/lib/v8:/opt/SUNWspro/lib:/usr/ccs/lib:/usr/lib
[17]    RPATH           /opt/SUNWspro/lib/rw7:/opt/SUNWspro/lib/v8:/opt/SUNWspro/lib:/opt/SUNWspro/lib/v8:/opt/SUNWspro/lib:/usr/ccs/lib:/usr/lib
The list of libraries matches what we see being looked for, so that makes sense. The problem is that the compiled in library search path contains places that it shouldn't (and some repeated), so it needlessly searches those locations (and multiple times at that) when mysql starts up.
So, problem solved. And, as I said earlier, the idea is that you be able to see this anomalous activity in one of the jkstat tools and click on it to drill down into the system to see what's going on, so that all the dtrace is done automatically on the fly for you.
It won't be that easy, of course. I'm relying on the fbt provider, so that I need to pretty well write the dtrace script by hand for each function I wish to investigate. (There isn't even a consistent naming or calling scheme - you can't just replace ufs by procfs and expect it to work.) But fortunately we have the OpenSolaris source to look at to see what's actually going on underneath the covers.
