It's been an awful long time since I thought about Java applets.
A while ago I updated a Java jigsaw application, Sphaero 2, and it was just a regular desktop application. Recently I got asked if it was possible to use it in a web page - as an applet.
This turned out to be incredibly easy. In parallel with the main application (which is a JFrame), implement the same code as part of a JApplet. Took me a few minutes to do (and a bit longer to clean it up and refactor it), so if you go to the Sphaero 2 page there are now a number of sample images that will launch a Java applet if you've got Java support in your browser.
Encouraged by this, I added applet support to JKstat. The idea is to set up a JKstat server, and if you point a web browser directly at the server then you get a page containing the JKstat applet, which can then connect back to the server it was downloaded from (the applet security model says that you can connect back to where you came from, so that's OK) to gather statistics.
This proved to be a little harder. It looks like this only works (in the case of an unsigned applet) for the REST variant of the client-server protocol. If I try it with XML-RPC then it looks like it wants to get DTDs for validation, and gets security exceptions trying to get them. So the standalone JKstat server doesn't work as is.
But that's not too bad, because I've got several options for serving the data using the REST protocol. From my sample play server, to node-kstat, or I've been testing a RESTful server based on Jersey.
It's been a useful learning exercise, and I actually find the results to be quite useful. Maybe applets will become fashionable again?
Saturday, March 17, 2012

Monday, December 12, 2011
JKstat at Play!
The Play framework seems to be quite popular around Cambridge.
For those not familiar with it, it's a java application framework built for REST. And, like Ruby on Rails, it emphasizes convention over configuration.
Rather than creating yet another boring blogging example I decided to use JKstat as an example, and see how involved building a RESTful JKstat server was using the Play framework.
Creating a project is easy:
The one thing I'm not keen on is the way it manages dependencies for you to get you jar files. You can either mess about with yaml files, or drop the jar file into the lib directory of the project. Full details of the complex way are in the play directory of the JKstat source.
The next step is to decide how to route requests. The JKstat client only has a few requests, in a fairly fixed form. So I can write the routes file explicitly by hand:
All this means is that if a client requests /jkstat/list, then the list() method in the JKplay class gets called.
Slightly more complex, something of the form /jkstat/get/module/instance/name will invoke a call to get(module, instance, name).
Putting this in a routes file in the application's conf directory is all that's needed to set up the routing. The other thing you need to do is write the JKplay class and put the java source in the application's app/controllers directory. The class just contains public static void methods with the correct signatures. For example:
JKstat knows how to generate JSON output, and the renderJSON()call tells Play that this is JSON data (which just means it won't do anything with it, like format a template, which is the normal mode of operation).
And that's basically it. All I then had to do was run the project (with LD_LIBRARY_PATH set to find my jni library) and it was all set. The JKstat client was able to communicate with it just fine.
For those not familiar with it, it's a java application framework built for REST. And, like Ruby on Rails, it emphasizes convention over configuration.
Rather than creating yet another boring blogging example I decided to use JKstat as an example, and see how involved building a RESTful JKstat server was using the Play framework.
Creating a project is easy:
play new jkstat
The one thing I'm not keen on is the way it manages dependencies for you to get you jar files. You can either mess about with yaml files, or drop the jar file into the lib directory of the project. Full details of the complex way are in the play directory of the JKstat source.
The next step is to decide how to route requests. The JKstat client only has a few requests, in a fairly fixed form. So I can write the routes file explicitly by hand:
# JKstat queries get sent to JKplay
GET /jkstat/getkcid    JKplay.getkcid
GET /jkstat/list    JKplay.list
GET /jkstat/get/{module}/{instance}/{name} JKplay.get
All this means is that if a client requests /jkstat/list, then the list() method in the JKplay class gets called.
Slightly more complex, something of the form /jkstat/get/module/instance/name will invoke a call to get(module, instance, name).
Putting this in a routes file in the application's conf directory is all that's needed to set up the routing. The other thing you need to do is write the JKplay class and put the java source in the application's app/controllers directory. The class just contains public static void methods with the correct signatures. For example:
    public static void list() {
 KstatSet kss = new KstatSet(jkstat);
 renderJSON(kss.toJSON());
    }
JKstat knows how to generate JSON output, and the renderJSON()call tells Play that this is JSON data (which just means it won't do anything with it, like format a template, which is the normal mode of operation).
And that's basically it. All I then had to do was run the project (with LD_LIBRARY_PATH set to find my jni library) and it was all set. The JKstat client was able to communicate with it just fine.
Sunday, December 11, 2011
Editing cells in a JTable
For the recently released update to Jangle I wanted to do a couple of things for the cousin and sibling tabs.
First, I wanted to have the list of OIDs and associated data to be slightly better formatted and to update along with the charts. This wasn't too difficult - the chart knows what the data is, so I got it to extend AbstractTableModel and could then simply use JTable to display it, just calling fireTableDataChanged at the end of the loop that updates the data.
(As an aside, I'm irritated that the API doesn't include fireTableColumnsChanged. You can do the whole table, or a cell, or by row, but not by column.)
 The second thing I wanted to do was to allow the user to select the list of items to be shown in the chart. The picture above shows the table with the data, and how I wanted it to look. (And is exactly how I managed to implement it.)
Now, the table is already showing the list of available data, so I just added a third column to handle whether it's displayed in the chart or not. I simply implemented getColumnClass and returned Boolean.class for the third column, and the JTable automatically shows it as a checkbox. (With the value of the checkbox simply toggled from the underlying model.)
The next step was to be able to edit that field - tick or untick the checkbox - and get it to update the chart. The first step is easy enough - just get isCellEditable to return true for the third column.
I then actually got stuck, because the documentation simply isn't clear as to how to connect that all back up. I was looking for all sorts of listeners or event handlers, and couldn't find anything. Searching found a number of threads where someone else clearly didn't understand this either, with responses that were rude, patronising, or unhelpful - from people who regarded the answer as obvious.
Anyway, the important thing is that it really is easy and obvious once you've worked it out. Making the cell editable automatically creates a cell editor, and all the plumbing is created for you. All you have to do is implement setValueAt which gets called when you do your edit. So my implementation simply adds or removes the relevant field from the chart. (And because that's what's supplying the model, the value displayed in the checkbox automatically tracks it.)
That's the sort of basic thing that ought to be covered in documentation but isn't; this blog entry is there for the next time I forget how to do it.
First, I wanted to have the list of OIDs and associated data to be slightly better formatted and to update along with the charts. This wasn't too difficult - the chart knows what the data is, so I got it to extend AbstractTableModel and could then simply use JTable to display it, just calling fireTableDataChanged at the end of the loop that updates the data.
(As an aside, I'm irritated that the API doesn't include fireTableColumnsChanged. You can do the whole table, or a cell, or by row, but not by column.)
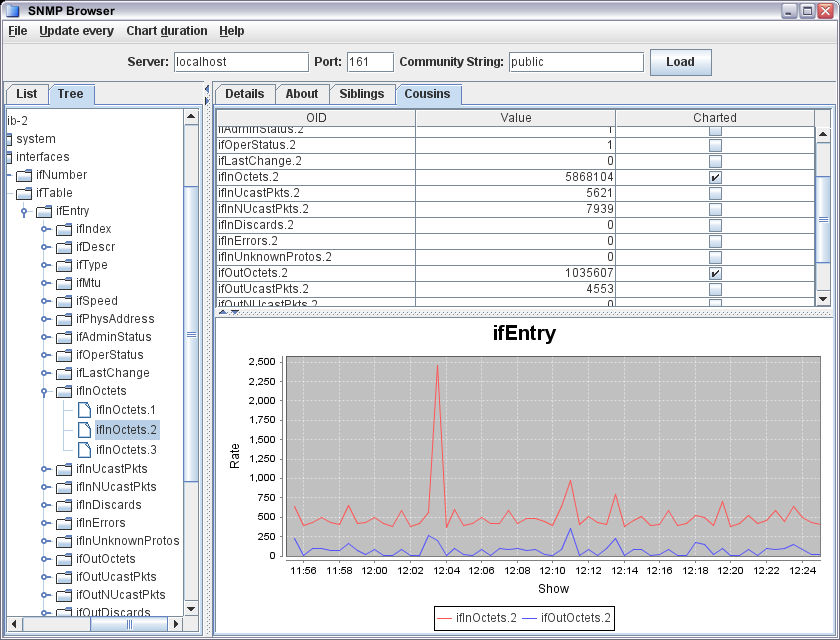
Now, the table is already showing the list of available data, so I just added a third column to handle whether it's displayed in the chart or not. I simply implemented getColumnClass and returned Boolean.class for the third column, and the JTable automatically shows it as a checkbox. (With the value of the checkbox simply toggled from the underlying model.)
The next step was to be able to edit that field - tick or untick the checkbox - and get it to update the chart. The first step is easy enough - just get isCellEditable to return true for the third column.
I then actually got stuck, because the documentation simply isn't clear as to how to connect that all back up. I was looking for all sorts of listeners or event handlers, and couldn't find anything. Searching found a number of threads where someone else clearly didn't understand this either, with responses that were rude, patronising, or unhelpful - from people who regarded the answer as obvious.
Anyway, the important thing is that it really is easy and obvious once you've worked it out. Making the cell editable automatically creates a cell editor, and all the plumbing is created for you. All you have to do is implement setValueAt which gets called when you do your edit. So my implementation simply adds or removes the relevant field from the chart. (And because that's what's supplying the model, the value displayed in the checkbox automatically tracks it.)
That's the sort of basic thing that ought to be covered in documentation but isn't; this blog entry is there for the next time I forget how to do it.
Saturday, December 03, 2011
Building current gcc on Solaris 10
While Solaris 10 comes with gcc, it's quite an old version. For some modern code, you need to use a newer version - this is the case in my Node.js for Solaris builds, for example.
Actually building a current gcc on Solaris 10 turns out to be reasonably straightforward but, as in most things, there's a twist. So the follwoing is the procedure I've used successfully to get 4.6.X built.
You first need to download the release tarball from http://gcc.gnu.org/, and unpack it:
There are 3 prerequisites: gmp (4.3.2), mpfr (2.4.2), and mpc (0.8.1). However, you should use the specific version mentioned, which may not be the current versions. Conveniently, there's a copy of the right versions on ftp://gcc.gnu.org/pub/gcc/infrastructure/. Go into the gcc source, unpack them, and rename them to remove the version numbers.
You have to build from outside the tree. If you followed the above, you'll be in the parent to gcc-4.6.2. Create a build directory and change into it:
mkdir build
cd build
Then you're ready to configure and build:
env PATH=/usr/bin:$PATH gmake install
There are three things to note here.
First is that I'm installing it into a location that is specific to this particular version of gcc. You don't have to, but I maintain large numbers of different versions of all sorts of applications, so they always live in their own space. You can put symlinks into a common location if necessary.
The second is one of the key tricks: I just build c, c++, and fortran. They're the only languages I actually need, and the build dies spectacularly with other languages enabled.
The third is that I force /usr/bin to the front of the PATH. Not ucb, and not xpg4 either.
You'll have to wait a while (and then some), but hopefully when that's all finished you'll have a modern compiler installed that will make building modern software such as Node.js much easier.
Actually building a current gcc on Solaris 10 turns out to be reasonably straightforward but, as in most things, there's a twist. So the follwoing is the procedure I've used successfully to get 4.6.X built.
You first need to download the release tarball from http://gcc.gnu.org/, and unpack it:
bzcat /path/to/gcc-4.6.2.tar.bz2 | gtar xf -
There are 3 prerequisites: gmp (4.3.2), mpfr (2.4.2), and mpc (0.8.1). However, you should use the specific version mentioned, which may not be the current versions. Conveniently, there's a copy of the right versions on ftp://gcc.gnu.org/pub/gcc/infrastructure/. Go into the gcc source, unpack them, and rename them to remove the version numbers.
cd gcc-4.6.2
bzcat /path/to/gmp-4.3.2.tar.bz2 | gtar xf -
mv gmp-4.3.2 gmp
mv gmp-4.3.2 gmp
zcat /path/to/mpfr-2.4.2.tar.bz2 | gtar xf -
mv mpfr-2.4.2 mpfr
gzcat /path/to/mpc-0.8.1.tar.gz | gtar xf -
mv mpc-0.8.1 mpc
mv mpfr-2.4.2 mpfr
gzcat /path/to/mpc-0.8.1.tar.gz | gtar xf -
mv mpc-0.8.1 mpc
cd ..
You have to build from outside the tree. If you followed the above, you'll be in the parent to gcc-4.6.2. Create a build directory and change into it:
cd build
Then you're ready to configure and build:
env PATH=/usr/bin:$PATH ../gcc-4.6.2/configure \
--prefix=/usr/local/versions/gcc-4.6.2 \
--enable-languages=c,c++,fortran
env PATH=/usr/bin:$PATH gmake -j 4env PATH=/usr/bin:$PATH gmake install
There are three things to note here.
First is that I'm installing it into a location that is specific to this particular version of gcc. You don't have to, but I maintain large numbers of different versions of all sorts of applications, so they always live in their own space. You can put symlinks into a common location if necessary.
The second is one of the key tricks: I just build c, c++, and fortran. They're the only languages I actually need, and the build dies spectacularly with other languages enabled.
The third is that I force /usr/bin to the front of the PATH. Not ucb, and not xpg4 either.
You'll have to wait a while (and then some), but hopefully when that's all finished you'll have a modern compiler installed that will make building modern software such as Node.js much easier.
Monday, November 07, 2011
Zooming into images
I spend rather a lot of my time working with images. Scanning and digitizing is one thing we do on a fairly large scale.
To allow customers to see image detail at high resolution, we use Zoomify extensively. We generate the images in advance, using ZoomifyImage. OK, so we end up with huge numbers of files to store, but this is the 21st century and we can cope with it.
There are other options available that do similar things, of course. Just to mention a few: Deep Zoom, OpenZoom, and OpenLayers. One snag with some of these zooming capabilities is that they require browser plugins (Flash or Silverlight). Not only does this hurt users who don't have the plugin installed, but some platforms (OK, let's call out the iPad here) don't have any prospect of Flash or Silverlight.
However, modern systems do have HTML5 capable browsers, and HTML5 is really powerful.
A quick search finds CanvasZoom, which is a pretty good start. Given a set of Deep Zoom tiles it just works. I tried it on an iPad and it sort of works, not really doing touch properly. So I forked it on github (with ImageLoader for compatibility) and played with adding touch support.
It turns out the adding touch handling is pretty trivial. There's just the touchstart, touchend and touchmove events to handle. You want to call event.preventDefault() so as to stop the normal platform handling of moves in particular. The only tricky bit was working out that while you can get the coordinates for touchstart and touchmove from event.targetTouches[0], for touchend you have to look back at event.changedTouches[0]. So, poke the image and it zooms, poke and move and you can pan the image.
One thing I mean to do is to look at whether I can point it at a set of Zoomify tiles. I've already got lots of those, and just having one set of image tiles saves both processing time and storage. If not, I'll have to generate a whole load more images - I'm using deepjzoom which seems to do a pretty good job.
To allow customers to see image detail at high resolution, we use Zoomify extensively. We generate the images in advance, using ZoomifyImage. OK, so we end up with huge numbers of files to store, but this is the 21st century and we can cope with it.
There are other options available that do similar things, of course. Just to mention a few: Deep Zoom, OpenZoom, and OpenLayers. One snag with some of these zooming capabilities is that they require browser plugins (Flash or Silverlight). Not only does this hurt users who don't have the plugin installed, but some platforms (OK, let's call out the iPad here) don't have any prospect of Flash or Silverlight.
However, modern systems do have HTML5 capable browsers, and HTML5 is really powerful.
A quick search finds CanvasZoom, which is a pretty good start. Given a set of Deep Zoom tiles it just works. I tried it on an iPad and it sort of works, not really doing touch properly. So I forked it on github (with ImageLoader for compatibility) and played with adding touch support.
It turns out the adding touch handling is pretty trivial. There's just the touchstart, touchend and touchmove events to handle. You want to call event.preventDefault() so as to stop the normal platform handling of moves in particular. The only tricky bit was working out that while you can get the coordinates for touchstart and touchmove from event.targetTouches[0], for touchend you have to look back at event.changedTouches[0]. So, poke the image and it zooms, poke and move and you can pan the image.
One thing I mean to do is to look at whether I can point it at a set of Zoomify tiles. I've already got lots of those, and just having one set of image tiles saves both processing time and storage. If not, I'll have to generate a whole load more images - I'm using deepjzoom which seems to do a pretty good job.
Friday, October 14, 2011
Optimizing mysql with DTrace
I've got a mysql server that's a bit busy, and I idly wondered why. Now, this is mysql 4, so it's a bit old and doesn't have a lot of built-in diagnostics.
(In case you're wondering, we have an awful lot of legacy client code that issues queries using a join syntax that isn't supported by later versions of mysql, so simply upgrading mysql isn't an option.)
This is running on Solaris, and a quick look with iostat indicates that the server isn't doing any physical I/O. That's good. A quick look with fsstat indicates that we're seeing quite a lot of read activity - all out of memory, as nothing goes to disk. (We're using zfs, which makes it trivially easy to split the storage up to give mysql its own file system, so we can monitor just the mysql traffic using fsstat.)
As an aside, when reading MyISAM tables the server relies on the OS to buffer table data in RAM, so you actually see the reads of tables as reads of the underlying files, which gets caught in fsstat and makes the following trivial.
But, which tables are actually being read? You might guess, by looking at the queries ("show full processlist" is your friend), but that simply tells you which tables are being accessed, not how much data is being read from each one.
Given that we're on Solaris, it's trivial to use DTrace to simply count both the read operations and the bytes read, per file. The following one-liners from the DTrace Book are all we need. First, to count reads per file:
dtrace -n 'syscall::read:entry /execname == "mysqld"/ { @[fds[arg0].fi_pathname] = count(); }'
and bytes per file:
dtrace -n 'fsinfo:::read /execname == "mysqld"/ { @[args[0]->fi_pathname] = sum(arg1); }'
With DTrace, aggregation is built in so there's no need to post-process the data.
The latter is what's interesting here. So running that quickly and looking at the last 3 lines which are the most heavily read files:
/mysql/data/foobar/subscriptions_table.MYD 42585701
/mysql/data/foobar/concurrent_accesses.MYD 83717726
/mysql/data/foobar/databases_table.MYD 177066629
That last table accounts for well over a third of the total bytes read. A quick look indicates that it's a very small table (39kbytes whereas other tables are quite a bit larger).
A quick look in mysql using DESCRIBE TABLE showed that this table had no indexed columns, so the problem is that every query is doing a full table scan. I added a quick index on the most likely looking column and the bytes read drops down to almost nothing, with a little speedup and corresponding reduction of load on the server.
I've used this exact technique quite a few times now - fsstat showing huge reads, a DTrace one-liner to identify the errant table. Many times, users and developers set up a simple mysql instance, and it's reasonably quick to start with so they don't bother with thinking about an index. Later (possibly years later) data and usage grows and performance drops as a result. And often they're just doing a very simple SELECT.
It's not always that simple. The other two most heavily read tables are also interesting. One of them is quite large, gets a lot of accesses, and ends up being quite sparse. Running OPTIMIZE TABLE to compact out the gaps due to deleted rows helped a lot there. The other one is actually the one used by the funky join query that's blocking the mysql version upgrade. No index I create makes any difference, and I suspect that biting the bullet and rewriting the query (or restructuring the tables somewhat more sanely) is what's going to be necessary to make any improvements.
(In case you're wondering, we have an awful lot of legacy client code that issues queries using a join syntax that isn't supported by later versions of mysql, so simply upgrading mysql isn't an option.)
This is running on Solaris, and a quick look with iostat indicates that the server isn't doing any physical I/O. That's good. A quick look with fsstat indicates that we're seeing quite a lot of read activity - all out of memory, as nothing goes to disk. (We're using zfs, which makes it trivially easy to split the storage up to give mysql its own file system, so we can monitor just the mysql traffic using fsstat.)
As an aside, when reading MyISAM tables the server relies on the OS to buffer table data in RAM, so you actually see the reads of tables as reads of the underlying files, which gets caught in fsstat and makes the following trivial.
But, which tables are actually being read? You might guess, by looking at the queries ("show full processlist" is your friend), but that simply tells you which tables are being accessed, not how much data is being read from each one.
Given that we're on Solaris, it's trivial to use DTrace to simply count both the read operations and the bytes read, per file. The following one-liners from the DTrace Book are all we need. First, to count reads per file:
dtrace -n 'syscall::read:entry /execname == "mysqld"/ { @[fds[arg0].fi_pathname] = count(); }'
and bytes per file:
dtrace -n 'fsinfo:::read /execname == "mysqld"/ { @[args[0]->fi_pathname] = sum(arg1); }'
With DTrace, aggregation is built in so there's no need to post-process the data.
The latter is what's interesting here. So running that quickly and looking at the last 3 lines which are the most heavily read files:
/mysql/data/foobar/subscriptions_table.MYD 42585701
/mysql/data/foobar/concurrent_accesses.MYD 83717726
/mysql/data/foobar/databases_table.MYD 177066629
That last table accounts for well over a third of the total bytes read. A quick look indicates that it's a very small table (39kbytes whereas other tables are quite a bit larger).
A quick look in mysql using DESCRIBE TABLE showed that this table had no indexed columns, so the problem is that every query is doing a full table scan. I added a quick index on the most likely looking column and the bytes read drops down to almost nothing, with a little speedup and corresponding reduction of load on the server.
I've used this exact technique quite a few times now - fsstat showing huge reads, a DTrace one-liner to identify the errant table. Many times, users and developers set up a simple mysql instance, and it's reasonably quick to start with so they don't bother with thinking about an index. Later (possibly years later) data and usage grows and performance drops as a result. And often they're just doing a very simple SELECT.
It's not always that simple. The other two most heavily read tables are also interesting. One of them is quite large, gets a lot of accesses, and ends up being quite sparse. Running OPTIMIZE TABLE to compact out the gaps due to deleted rows helped a lot there. The other one is actually the one used by the funky join query that's blocking the mysql version upgrade. No index I create makes any difference, and I suspect that biting the bullet and rewriting the query (or restructuring the tables somewhat more sanely) is what's going to be necessary to make any improvements.
Saturday, October 08, 2011
JKstat 0.60, handling kstat chain updates correctly
I've just updated JKstat, now up to version 0.60.
The key change this time, and the reason for a jump in version number (the previous was 0.53) is that I've changed the way that updates to the kstat chain are handled.
Now, libkstat has a kstat_chain_update() function, which you call to synchronize your idea of what kstats exist with the current view held by the kernel. And you can look at the return value to see if anything has changed.
This only works if you're running in a single thread, of course. If you have multiple threads, then it's possible that only one will detect a change. Even worse if you have a server with multiple clients. So, the only reliable way for any consumer to detect whether the chain has been updated is to retrieve the current kstat chain ID and compare it with the one it holds.
This has largely been hidden because I've usually used the KstatSet class to track updates, and it does the right thing. It checks the kstat ID and doesn't blindly trust the return code from kstat_chain_update(). (And it handles subsets of kstats and will only notify its consumers of any relevant changes.)
So what I've finally done is eliminate the notion of calling kstat_chain_update(), which should have been done long ago. The native code still calls this internally, to make sure it's correctly synchronized with the kernel, but all consumers need to track the kstat chain ID themselves.
This change actually helps client-server operation, as it means we only need one call to see if anything has changed rather than the two that were needed before.
The key change this time, and the reason for a jump in version number (the previous was 0.53) is that I've changed the way that updates to the kstat chain are handled.
Now, libkstat has a kstat_chain_update() function, which you call to synchronize your idea of what kstats exist with the current view held by the kernel. And you can look at the return value to see if anything has changed.
This only works if you're running in a single thread, of course. If you have multiple threads, then it's possible that only one will detect a change. Even worse if you have a server with multiple clients. So, the only reliable way for any consumer to detect whether the chain has been updated is to retrieve the current kstat chain ID and compare it with the one it holds.
This has largely been hidden because I've usually used the KstatSet class to track updates, and it does the right thing. It checks the kstat ID and doesn't blindly trust the return code from kstat_chain_update(). (And it handles subsets of kstats and will only notify its consumers of any relevant changes.)
So what I've finally done is eliminate the notion of calling kstat_chain_update(), which should have been done long ago. The native code still calls this internally, to make sure it's correctly synchronized with the kernel, but all consumers need to track the kstat chain ID themselves.
This change actually helps client-server operation, as it means we only need one call to see if anything has changed rather than the two that were needed before.
Friday, September 30, 2011
Limiting CPU usage in a zone
By default, a Solaris zone has access to all the resources of the host it's running on. Normally, I've found this works fine - most applications I put in zones aren't all that resource hungry.
But if you do want to place some limits on a zone, then the zone configuration offers a couple of options.
First, you can simply allocate some CPUs to the zone:
Or, you can cap the cpu utilization of the zone:
I normally put all the configuration commands for a zone into a file, and use
In terms of stopping a zone monopolizing a machine, the two are fairly similar. Depending on the need, I've used both.
When using dedicated-cpu, it's not just a limit but a guarantee. Those cpus aren't available to other zones. Sometimes that's exactly what you want, but it does mean that those cpus will be idle if the zone they're allocated to doesn't use them.
Also, with dedicated-cpu, the zone thinks it's only got the specified number of cpus (just run psrinfo to see). Sometimes this is necessary for licensing, but there was one case where I needed this for something else: consolidating some really old systems running a version of the old Netscape Enterprise Server, and it would crash at startup. I worked out that this was because it collected performance statistics on all the cpus, and someone had decided that hard coding the array size at 100 (or something) would cover all future possibilities. That was, until I ran it one a T5140 with 128 cpus and it segfaulted. Just giving the zone 4 cpus allowed it to run just fine.
I use capped-cpu when I just want to stop a zone wiping out the machine. For example, I have a machine that runs application servers and a data build process. The data build process runs only rarely, but launches many parallel processes. When it had its own hardware that was fine: the machine would have occasional overload spikes but was otherwise OK. When shared with other workloads, we didn't want to change the process, but have the build zone capped at 30 or 40 cpus (on a 64-way system) so there's plety of cpu left over for other workloads.
One advantage of stopping runaways with capped-cpu is that you can limit each zone to, say, 80% of the system, and you can do that for all zones. It looks like you're overcommitting, but that's not really the case - uncapped is the same as a cap of all the cpus, so you're lower than that. This means that any one zone can't take the system out, but each zone still has most of the machine if it needs it (and the system has the available capacity).
The capability to limit memory also exists. I haven't yet had a case where that's been necessary, so have no practical experience to share.
But if you do want to place some limits on a zone, then the zone configuration offers a couple of options.
First, you can simply allocate some CPUs to the zone:
add dedicated-cpu
set ncpus=4
end
Or, you can cap the cpu utilization of the zone:
add capped-cpu
set ncpus=4
end
I normally put all the configuration commands for a zone into a file, and use
zonecfg -f to build the zone; if modifying a zone then I create a fragment like the above and load that the same way.In terms of stopping a zone monopolizing a machine, the two are fairly similar. Depending on the need, I've used both.
When using dedicated-cpu, it's not just a limit but a guarantee. Those cpus aren't available to other zones. Sometimes that's exactly what you want, but it does mean that those cpus will be idle if the zone they're allocated to doesn't use them.
Also, with dedicated-cpu, the zone thinks it's only got the specified number of cpus (just run psrinfo to see). Sometimes this is necessary for licensing, but there was one case where I needed this for something else: consolidating some really old systems running a version of the old Netscape Enterprise Server, and it would crash at startup. I worked out that this was because it collected performance statistics on all the cpus, and someone had decided that hard coding the array size at 100 (or something) would cover all future possibilities. That was, until I ran it one a T5140 with 128 cpus and it segfaulted. Just giving the zone 4 cpus allowed it to run just fine.
I use capped-cpu when I just want to stop a zone wiping out the machine. For example, I have a machine that runs application servers and a data build process. The data build process runs only rarely, but launches many parallel processes. When it had its own hardware that was fine: the machine would have occasional overload spikes but was otherwise OK. When shared with other workloads, we didn't want to change the process, but have the build zone capped at 30 or 40 cpus (on a 64-way system) so there's plety of cpu left over for other workloads.
One advantage of stopping runaways with capped-cpu is that you can limit each zone to, say, 80% of the system, and you can do that for all zones. It looks like you're overcommitting, but that's not really the case - uncapped is the same as a cap of all the cpus, so you're lower than that. This means that any one zone can't take the system out, but each zone still has most of the machine if it needs it (and the system has the available capacity).
The capability to limit memory also exists. I haven't yet had a case where that's been necessary, so have no practical experience to share.
Monday, August 08, 2011
Thoughts on ZFS dedup
Following on from some thoughts on ZFS compression, and nudged by one of the comments, what about ZFS dedup?
There's also a somewhat less opinionated article that you should definitely read.
So, my summary: unlike compression, dedup should be avoided unless you have a specific niche use.
Even for a modest storage system, say something in the 25TB range, then you should be aiming for half a terabyte of RAM (or L2ARC). Read the article above. And the point isn't just the cost of an SSD or a memory DIMM, it's the cost of a system that can take enough SSD devices or has enough memory capacity. And then think about a decent size storage system that may scale to 10 times that size. Eventually, the time may come, but my point is that while the typical system you might use today already has cpu power going spare to do compression for you, you're looking at serious engineering to get the capability to do dedup.
We can also see when turning on dedup might make sense. A typical (server) system may have 48G of memory so, scaled from the above, something in the range of 2.5TB of unique data might be a reasonable target. Frankly, that's pretty small, and you actually need to get a pretty high dedup ratio to make the savings worthwhile.
I've actually tested dedup on some data where I expected to get a reasonable benefit: backup images. The idea here is that you're saving similar data multiple times (either multiple backups of the same host, or backups of like data from lots of different hosts). I got a disappointing saving - of order 7% or so. Given the amount of memory we would have needed to put into a box to have 100TB of storage, this simply wasn't going to fly. By comparison, I see 25-50% compression on the same data, and you get that essentially for free. And that's part of the argument behind having compression on all the time, and avoiding dedup entirely.
I have another opinion here as well, which is that using dedup to identify identical data after the fact is the wrong place to do it, and indicates a failure in data management. If you know you have duplicate data (and you pretty much have to know you've got duplicate data to make the decision to enable dedup in the first place) then you ought to have management in place to avoid creating multiple copies of it: snapshots, clones, single-instance storage, or the like. Not generating duplicate data in the first place is a lot cheaper than creating all the multiple copies and then deduplicating them afterwards.
Don't get me wrong: deduplication has its place. But it's very much a niche product and certainly not something that you can just enable by default.
There's also a somewhat less opinionated article that you should definitely read.
So, my summary: unlike compression, dedup should be avoided unless you have a specific niche use.
Even for a modest storage system, say something in the 25TB range, then you should be aiming for half a terabyte of RAM (or L2ARC). Read the article above. And the point isn't just the cost of an SSD or a memory DIMM, it's the cost of a system that can take enough SSD devices or has enough memory capacity. And then think about a decent size storage system that may scale to 10 times that size. Eventually, the time may come, but my point is that while the typical system you might use today already has cpu power going spare to do compression for you, you're looking at serious engineering to get the capability to do dedup.
We can also see when turning on dedup might make sense. A typical (server) system may have 48G of memory so, scaled from the above, something in the range of 2.5TB of unique data might be a reasonable target. Frankly, that's pretty small, and you actually need to get a pretty high dedup ratio to make the savings worthwhile.
I've actually tested dedup on some data where I expected to get a reasonable benefit: backup images. The idea here is that you're saving similar data multiple times (either multiple backups of the same host, or backups of like data from lots of different hosts). I got a disappointing saving - of order 7% or so. Given the amount of memory we would have needed to put into a box to have 100TB of storage, this simply wasn't going to fly. By comparison, I see 25-50% compression on the same data, and you get that essentially for free. And that's part of the argument behind having compression on all the time, and avoiding dedup entirely.
I have another opinion here as well, which is that using dedup to identify identical data after the fact is the wrong place to do it, and indicates a failure in data management. If you know you have duplicate data (and you pretty much have to know you've got duplicate data to make the decision to enable dedup in the first place) then you ought to have management in place to avoid creating multiple copies of it: snapshots, clones, single-instance storage, or the like. Not generating duplicate data in the first place is a lot cheaper than creating all the multiple copies and then deduplicating them afterwards.
Don't get me wrong: deduplication has its place. But it's very much a niche product and certainly not something that you can just enable by default.
Sunday, August 07, 2011
Thoughts on ZFS compression
Apart from the sort of features that I now take for granted in a filesystem (data integrity, easy management, extreme scalability, unlimited snapshots), ZFS also has built in compression.
I've already noted how this can be used to compress backup catalogs. One important thing here is that it's completely transparent, which isn't true of any scheme that goes around compressing the files themselves.
Recently, I've (finally) started to enable compression more widely, as a matter of course. Certainly on new systems there's no excuse, at the default level of compression at any rate.
There was a caveat there: at the default compression level. The point here being that the default level of compression can get you decent gains and is essentially free: you gain space and reduce I/O for a negligible CPU cost. The more aggressive compression schemes can compress your data more, but having tried them it's clear that there's a significant performance hit: in some cases when I tried it the machine can freeze completely for a few seconds, which is clearly noticeable to users. Newer more powerful machines shouldn't have that problem, and there have been improvements in Solaris as well that keep the rest of the system more responsive. I still feel, though, that enabling more aggressive compression than the default is something that should only be done selectively when you've actually compared the costs and benefits.
So, I'm enabling compression on every filesystem containing regular data from now on.
The exception, still, is large image filesystems. Images in TIFF and JPEG format are already compressed so the benefit is pretty negligible. And the old thumpers we still use extensively have relatively little CPU power (both compared to more modern systems, and for the amount of data and I/O these systems do). Compression here is enabled more selectively.
Given the continuing growth in cpu power - even our entry-level systems are 24-way now - I'm expecting it won't be long before we get to the point where enabling more aggressive compression all the time is going to be a no-brainer.
I've already noted how this can be used to compress backup catalogs. One important thing here is that it's completely transparent, which isn't true of any scheme that goes around compressing the files themselves.
Recently, I've (finally) started to enable compression more widely, as a matter of course. Certainly on new systems there's no excuse, at the default level of compression at any rate.
There was a caveat there: at the default compression level. The point here being that the default level of compression can get you decent gains and is essentially free: you gain space and reduce I/O for a negligible CPU cost. The more aggressive compression schemes can compress your data more, but having tried them it's clear that there's a significant performance hit: in some cases when I tried it the machine can freeze completely for a few seconds, which is clearly noticeable to users. Newer more powerful machines shouldn't have that problem, and there have been improvements in Solaris as well that keep the rest of the system more responsive. I still feel, though, that enabling more aggressive compression than the default is something that should only be done selectively when you've actually compared the costs and benefits.
So, I'm enabling compression on every filesystem containing regular data from now on.
The exception, still, is large image filesystems. Images in TIFF and JPEG format are already compressed so the benefit is pretty negligible. And the old thumpers we still use extensively have relatively little CPU power (both compared to more modern systems, and for the amount of data and I/O these systems do). Compression here is enabled more selectively.
Given the continuing growth in cpu power - even our entry-level systems are 24-way now - I'm expecting it won't be long before we get to the point where enabling more aggressive compression all the time is going to be a no-brainer.
Thursday, July 28, 2011
A bigger hammer than svcadm
One advantage of the service management facility (SMF) in Solaris is that you can treat services as single units: you can use
Sometimes, though, that's not enough. If your system is under real stress (think swapping itself to death with thousands of rogue processes) then you can find that
So, what to to? It's actually quite easy, once you know what you're looking for.
The first step is to get details of the service using
(Why use -9 rather than a friendlier signal? In this case, it was because I just wanted the processes to die. Asking then nicely involves swapping them back in, which would take forever.)
svcadm to control all the processes associated with a service in one command. This makes dealing with problems a lot easier than trying to grope through ps output trying to kill the right processes.Sometimes, though, that's not enough. If your system is under real stress (think swapping itself to death with thousands of rogue processes) then you can find that
svcadm disable or svcadm restart simply don't take.So, what to to? It's actually quite easy, once you know what you're looking for.
The first step is to get details of the service using
svcs with the -v switch. For example:(you'll notice a presentation bug here). The important thing is the number in the CTID column. This is the contract ID. You can then use
# svcs -v server:rogue
STATE          NSTATE        STIME    CTID   FMRI
online         -             10:06:05 7226124svc:/network/server:rogue
pkill with the -c switch to send a signal to every process in that process contract, which defines the boundaries of the service. So:and they will all go. And then, of course SMF will neatly restart your service automatically for you.
pkill -9 -c 7226124
(Why use -9 rather than a friendlier signal? In this case, it was because I just wanted the processes to die. Asking then nicely involves swapping them back in, which would take forever.)
Tuesday, July 26, 2011
The Oracle Hardware Management Pack
I've recently acquired some new servers - some SPARC T3-1s and some x86 based X4170M2s.
One of the interesting things about these is that the internal drives are multipathed by default - so you get device names like c0t6006016021B02C00F22A3EED6CADE011d0s2 rather than the more traditional c0t0d0s2.
This makes building a jumpstart profile a bit more tedious than normal, because you need to have a separate disk configuration section for every box - because the device names are different on each box.
However, there's another minor problem. How do you easily map from the WWN-based device names to physical positions in the chassis? You really need this so you're sure you're swapping the right drive. And while a SPARC system really doesn't mind which disk it's booting from, for an x86 system it helps if you install the OS on the first disk in the BIOS boot order.
The answer is to install the Oracle Hardware Management Pack. (Why this isn't even on the preinstalled image I can't explain.) This seems to work on most current and recent Sun server models.
Now, actually getting the Hardware Management Pack isn't entirely trivial. So prepare to do battle with the monstrosity called My Oracle Support.
So, you're logged in to My Oracle Support. Click the Patches & Updates tab. In the Patch Search area, click the link marked 'Product or Family (Advanced)'. Then scroll down the dropdown list and select the item that says 'Oracle Hardware Management Pack'. Then choose some of the most recent releases (highest version numbers - note that different hardware platforms match different version numbers of the software) and select your desired platform (essentially, SPARC or X86 or both) from the dropdown to the right of where it says 'Platform is'. Then hit the Search button.
Assuming the flash gizmo hasn't crashed out on you (again) you should get a list of patches. No, I have no idea why they're called patches when they're not. You can then click on the one you want and download it.
What you get is a zip file, so you can unzip that, cd into it and then into the SOFTWARE directory inside it, and then run the install.bin file you find there. (You may have to chmod the install.bin file to make it executable.) I just accept all the defaults and let it get on with it.
On a preinstalled system it may claim it's already installed. It probably isn't - just 'pkgrm ipmitool' first. And if you're using your own jumpstart profile, make sure the SUNWCsma cluster is installed. It may be necessary to wait a while and then 'svcadm restart sma' to get things to take the first time.
So, once it's installed, what can you do?
The first thing is that there's a Storage tab in the ILOM web interface. Go there once you've got the hardware management pack installed and you should be able to see the controllers and disks enumerated.
On the system itself, the
will give a verbose listing of the disks on controller c0. (And. just to remind you, the c0 in c0t6006016021B02C00F22A3EED6CADE011d0s2 doesn't refer to physical controller 0.)
The hardware management pack is really useful - if you're running current generation Sun T-series or X-series hardware, you ought to get it and use it.
One of the interesting things about these is that the internal drives are multipathed by default - so you get device names like c0t6006016021B02C00F22A3EED6CADE011d0s2 rather than the more traditional c0t0d0s2.
This makes building a jumpstart profile a bit more tedious than normal, because you need to have a separate disk configuration section for every box - because the device names are different on each box.
However, there's another minor problem. How do you easily map from the WWN-based device names to physical positions in the chassis? You really need this so you're sure you're swapping the right drive. And while a SPARC system really doesn't mind which disk it's booting from, for an x86 system it helps if you install the OS on the first disk in the BIOS boot order.
The answer is to install the Oracle Hardware Management Pack. (Why this isn't even on the preinstalled image I can't explain.) This seems to work on most current and recent Sun server models.
Now, actually getting the Hardware Management Pack isn't entirely trivial. So prepare to do battle with the monstrosity called My Oracle Support.
So, you're logged in to My Oracle Support. Click the Patches & Updates tab. In the Patch Search area, click the link marked 'Product or Family (Advanced)'. Then scroll down the dropdown list and select the item that says 'Oracle Hardware Management Pack'. Then choose some of the most recent releases (highest version numbers - note that different hardware platforms match different version numbers of the software) and select your desired platform (essentially, SPARC or X86 or both) from the dropdown to the right of where it says 'Platform is'. Then hit the Search button.
Assuming the flash gizmo hasn't crashed out on you (again) you should get a list of patches. No, I have no idea why they're called patches when they're not. You can then click on the one you want and download it.
What you get is a zip file, so you can unzip that, cd into it and then into the SOFTWARE directory inside it, and then run the install.bin file you find there. (You may have to chmod the install.bin file to make it executable.) I just accept all the defaults and let it get on with it.
On a preinstalled system it may claim it's already installed. It probably isn't - just 'pkgrm ipmitool' first. And if you're using your own jumpstart profile, make sure the SUNWCsma cluster is installed. It may be necessary to wait a while and then 'svcadm restart sma' to get things to take the first time.
So, once it's installed, what can you do?
The first thing is that there's a Storage tab in the ILOM web interface. Go there once you've got the hardware management pack installed and you should be able to see the controllers and disks enumerated.
On the system itself, the
raidconfig command is very useful. Something likewill give you a device summary, and
raidconfig list all
raidconfig list disk -c c0 -v
will give a verbose listing of the disks on controller c0. (And. just to remind you, the c0 in c0t6006016021B02C00F22A3EED6CADE011d0s2 doesn't refer to physical controller 0.)
The hardware management pack is really useful - if you're running current generation Sun T-series or X-series hardware, you ought to get it and use it.
Friday, July 08, 2011
CPU visualization
Over the years, simple tools like cpustate have allowed you to get a quick visualization of cpu utilization on Solaris. It's sufficiently simple and useful that emulating it was one of the first demos I put together using JKstat.
Its presentation starts to suffer as core and thread counts continue to rise. So recently I added vertical bars as an option. This allows a more compact representation, and also works better given that most screens are wider that they are tall.
Still, even that doesn't work very well on a 128-way machine. And, by treating all cpus equally, you can't see how the load is distributed in terms of the processor topology.
However, as of the new release of SolView there's now a 'vertical' option for the enhanced cpustate demo included there.

So, what's here? This is a 2-chip system (actually an X4170M2), each chip has 6 cores, each of which has 2 threads. The chips are stacked above each other, and within each chip is a smaller display for each core, and within each core are its threads. All grouped together to show how the threads and cores are related, and each core and chip having an aggregate display.

Above is a T5140 - 2 chips, each with 8 cores each with 8 threads.
I find it interesting to watch these for a while, and you can see how work is scheduled. What you normally see is an even spread across the cores. Normally, if there's an idle core you see a process sent there rather than running on a thread on a busy core and competing for shared resources. (Not always: you can see on the first graph that there's one idle core and another core with both threads busy, which is unusual.) The scheduler is clearly aware of the processor topology and generally distributes the work pretty well to make best use of the available cores.
Its presentation starts to suffer as core and thread counts continue to rise. So recently I added vertical bars as an option. This allows a more compact representation, and also works better given that most screens are wider that they are tall.
Still, even that doesn't work very well on a 128-way machine. And, by treating all cpus equally, you can't see how the load is distributed in terms of the processor topology.
However, as of the new release of SolView there's now a 'vertical' option for the enhanced cpustate demo included there.

So, what's here? This is a 2-chip system (actually an X4170M2), each chip has 6 cores, each of which has 2 threads. The chips are stacked above each other, and within each chip is a smaller display for each core, and within each core are its threads. All grouped together to show how the threads and cores are related, and each core and chip having an aggregate display.

Above is a T5140 - 2 chips, each with 8 cores each with 8 threads.
I find it interesting to watch these for a while, and you can see how work is scheduled. What you normally see is an even spread across the cores. Normally, if there's an idle core you see a process sent there rather than running on a thread on a busy core and competing for shared resources. (Not always: you can see on the first graph that there's one idle core and another core with both threads busy, which is unusual.) The scheduler is clearly aware of the processor topology and generally distributes the work pretty well to make best use of the available cores.
Thursday, June 30, 2011
Updated Node
As a result of a new version of Node being released, I've updated my Solaris 10 (x86) package, available here.
This updates Node to 0.4.9 and the bundled cURL to 7.21.7.
Building this was exactly the same as in my earlier posts. I've updated the patch, although the observant will notice that it's the same patch with the path updated; there's no functional change in the patch.
This updates Node to 0.4.9 and the bundled cURL to 7.21.7.
Building this was exactly the same as in my earlier posts. I've updated the patch, although the observant will notice that it's the same patch with the path updated; there's no functional change in the patch.
Tuesday, June 28, 2011
Node serving zipfiles
One problem I've been looking at recently is how to serve - efficiently - directories containing large numbers of tiny files to http clients. At the moment, we just create the files, put them on a filesystem, and let apache go figure it out.
The data is grouped, though, so that each directory is an easily identifiable and self-contained chunk of data. And, if a client accesses one file, chances are that they're going to access many of the other neighbouring files as well.
We're a tiny tiny fraction of the way into the project, and we're already up to 250 million files. Anyone who's suffered with traditional backup knows that you can't realistically back this data up, and we don't even try.
What I do, though, is generate a zip file of each directory. One file instead of 1000, many orders of magnitude less in your backup catalog (thinking about this sort of data, generating a backup index or catalog can be a killer), and you can stream large files instead of doing random I/O to tiny little files. We save the zip archives, not the original files.
So then, I've been thinking, why not serve content out of the zip files directly? We cut the number of files on the filesystem dramatically, improve performance, and make it much more manageable. And the access pattern is in our favour as well - once a client hits a file, they'll probably access many more files in the same zip archive, so we could prefetch the whole archive for even more efficiency.
A quick search turned up this article. It's not exactly what I wanted to do, but it's pretty close. So I was able to put together a very simple node script using the express framework that serves content out of a zip file.
So, a quick explanation:
See how easy it is to generate something pretty sophisticated using Node? And even I can look at the above and understand what it's doing.
Now, the above isn't terribly complete.
For one thing, I ought to work out the correct content type for each request. This isn't hard but adds quite a lot of lines of code.
The other thing that I want to do is to have the application handle multiple zip files. So you get express to split up the request into a zipfile name and the name of a file within the zip archive. And then keep a cache of recently used zipfiles.
Which leaves a little work for version 2.
The data is grouped, though, so that each directory is an easily identifiable and self-contained chunk of data. And, if a client accesses one file, chances are that they're going to access many of the other neighbouring files as well.
We're a tiny tiny fraction of the way into the project, and we're already up to 250 million files. Anyone who's suffered with traditional backup knows that you can't realistically back this data up, and we don't even try.
What I do, though, is generate a zip file of each directory. One file instead of 1000, many orders of magnitude less in your backup catalog (thinking about this sort of data, generating a backup index or catalog can be a killer), and you can stream large files instead of doing random I/O to tiny little files. We save the zip archives, not the original files.
So then, I've been thinking, why not serve content out of the zip files directly? We cut the number of files on the filesystem dramatically, improve performance, and make it much more manageable. And the access pattern is in our favour as well - once a client hits a file, they'll probably access many more files in the same zip archive, so we could prefetch the whole archive for even more efficiency.
A quick search turned up this article. It's not exactly what I wanted to do, but it's pretty close. So I was able to put together a very simple node script using the express framework that serves content out of a zip file.
// requires express and zipfile
// npm install express
// npm install zipfile
//

function isDir(pathname) {
 if (!pathname) {
  return false;
 } else {
  return pathname.slice(-1) == '/';
 }
}

var zipfile = require('zipfile').ZipFile;
var myzip = new zipfile('/home/peter/test.zip');

// hash of filenames and content
var ziptree = {};
for (var i = 0; i < myzip.names.length ; i++) {
 if (!isDir(myzip.names[i])) {
  ziptree[myzip.names[i]] = myzip.readFileSync(myzip.names[i])
 }
}

var app = require('express').createServer();

app.get('/zip/*', function(req, res){
    if(ziptree[req.params[0]]) {
 res.send(ziptree[req.params[0]], {'Content-Type': 'text/plain'});
    } else {
 res.send(404);
    }
});

app.listen(3000);
console.log("zip server listening on port %d", app.address().port);
So, a quick explanation:
- I open up a zipfile and, for each entry in it that isn't a directory, shove it into a hash with the name as the key and the data as the value.
- I use express to route any request under /zip/, the filename is everything after the /zip/, and I just grab that path from the hash and return the data.
See how easy it is to generate something pretty sophisticated using Node? And even I can look at the above and understand what it's doing.
Now, the above isn't terribly complete.
For one thing, I ought to work out the correct content type for each request. This isn't hard but adds quite a lot of lines of code.
The other thing that I want to do is to have the application handle multiple zip files. So you get express to split up the request into a zipfile name and the name of a file within the zip archive. And then keep a cache of recently used zipfiles.
Which leaves a little work for version 2.
Saturday, June 18, 2011
Node and kstat goodness
Now I've got got node.js built on Solaris (see blog entry 1 and blog entry 2) I've been playing with using it as a server.
So the next thing I did was to augment node-kstat from Bryan Cantrill's original. There's the odd minor fix, I've essentially completed the list of kstats supported (including most of the raw kstats), and added methods that give the support needed by JKstat, and there's an example jkstat.js script that can run as a server under node that the JKstat client can connect to.
A collection of my Node stuff is available here, including a Solaris 10 package for those of you unable to build it yourselves.
Of course, in order to use the node-kstat server I've had to add RESTful http client support to JKstat, which has now been updated with the 0.51 release.
JKstat also loses the JavaFX demos. It doesn't appear to me that JavaFX is going to be terribly interesting for a while. The 2.0 beta isn't available for Solaris at all (1.x wasn't available for SPARC anyway), and appears to be essentially incompatible anyway.
So the next thing I did was to augment node-kstat from Bryan Cantrill's original. There's the odd minor fix, I've essentially completed the list of kstats supported (including most of the raw kstats), and added methods that give the support needed by JKstat, and there's an example jkstat.js script that can run as a server under node that the JKstat client can connect to.
A collection of my Node stuff is available here, including a Solaris 10 package for those of you unable to build it yourselves.
Of course, in order to use the node-kstat server I've had to add RESTful http client support to JKstat, which has now been updated with the 0.51 release.
JKstat also loses the JavaFX demos. It doesn't appear to me that JavaFX is going to be terribly interesting for a while. The 2.0 beta isn't available for Solaris at all (1.x wasn't available for SPARC anyway), and appears to be essentially incompatible anyway.
Friday, June 17, 2011
Cache batteries on Sun 25xx arrays
I have a number of the old Sun 2530 disk arrays, and a batch that we bought 3 years ago have started to come up with the fault LED lit.
These arrays have cache batteries, and the batteries need replacing sometimes to ensure they're operating correctly. Originally, this was a simple 3 year timer. After 3 years, a timer expires and it generates a fault to let you know it's time to put in new batteries.
Current Oracle policy is different: rather than relying on a dumb timer and replacing batteries as a precaution, the systems are actually capable of monitoring the health of the batteries (they have built in SMART technology). As a result, they will only send out new batteries if there's actual evidence of a fault.
This is actually good, as it means we don't have to take unnecessary downtime to replace the batteries. (And it eliminates the risk of the battery replacement procedure accidentally causing more problems.)
Now, the management software version we have (6.xx) doesn't report the SMART status (but will report if a real failure occurs). So you can't see predictive failure, but if CAM just says "near expiration" then it's just the precautionary timer.
So, the solution is to check and reset the timer.
Go to CAM. (The exact location of the relevant menu item may vary depending on which version of CAM you've got, so you may have to go looking.)
Expand the Storage Systems tree
Select the array you want to fix
Click on service advisor
In the new window that pops up, verify that it's actually picked up the correct array. The name should be at the top of the expanded tree in the left-hand panel.
Under Array Troubleshooting and recovery, expand the Resetting the Controller Battery Age item.
Click on each battery in turn and follow the instructions.
This also applies to the 6x80 arrays as well, as I understand it, but I don't have any of those.
If you search for "2500 battery" on My Oracle Support, you'll find all this documented.
These arrays have cache batteries, and the batteries need replacing sometimes to ensure they're operating correctly. Originally, this was a simple 3 year timer. After 3 years, a timer expires and it generates a fault to let you know it's time to put in new batteries.
Current Oracle policy is different: rather than relying on a dumb timer and replacing batteries as a precaution, the systems are actually capable of monitoring the health of the batteries (they have built in SMART technology). As a result, they will only send out new batteries if there's actual evidence of a fault.
This is actually good, as it means we don't have to take unnecessary downtime to replace the batteries. (And it eliminates the risk of the battery replacement procedure accidentally causing more problems.)
Now, the management software version we have (6.xx) doesn't report the SMART status (but will report if a real failure occurs). So you can't see predictive failure, but if CAM just says "near expiration" then it's just the precautionary timer.
So, the solution is to check and reset the timer.
Go to CAM. (The exact location of the relevant menu item may vary depending on which version of CAM you've got, so you may have to go looking.)
Expand the Storage Systems tree
Select the array you want to fix
Click on service advisor
In the new window that pops up, verify that it's actually picked up the correct array. The name should be at the top of the expanded tree in the left-hand panel.
Under Array Troubleshooting and recovery, expand the Resetting the Controller Battery Age item.
Click on each battery in turn and follow the instructions.
This also applies to the 6x80 arrays as well, as I understand it, but I don't have any of those.
If you search for "2500 battery" on My Oracle Support, you'll find all this documented.
Wednesday, June 08, 2011
Node.js on Solaris, part 2
Here's a followup and slight correction to my notes on building node.js on Solaris 10.
If you read carefully, you'll notice that I specified --without-ssl to the configure command. This makes it build, as it looks like there's a dependency on a newer openssl than is shipped with Solaris 10. While this is good enough for some purposes, it turns out the the expresss module wants ssl (it's required, even if you don't use https, although all you have to do is delete the references).
So, a better way is to build a current openssl first and then get node to link against that. So for the openssl build:
Then you can unpack and patch node as before, then configure with
If you read carefully, you'll notice that I specified --without-ssl to the configure command. This makes it build, as it looks like there's a dependency on a newer openssl than is shipped with Solaris 10. While this is good enough for some purposes, it turns out the the expresss module wants ssl (it's required, even if you don't use https, although all you have to do is delete the references).
So, a better way is to build a current openssl first and then get node to link against that. So for the openssl build:
I'm using the Studio compilers here, as I normally do with things like openssl that provide libraries that might be used by other tools, although gcc should work fine. The important parts here are that it matches the architecture of your other components (so 32-bit, ie x86) and you build shared libraries.
gzcat openssl-1.0.0d.tar.gz | gtar xf -
cd openssl-1.0.0d
env CC=cc CXX=CC ./Configure --prefix=/opt/Node solaris-x86-cc shared
gmake -j 8
gmake install
Then you can unpack and patch node as before, then configure with
env LDFLAGS=-R/opt/Node/lib CFLAGS=-std=gnu99 ./configure --prefix=/opt/Node --openssl-includes=/opt/Node/include --openssl-lib=/opt/Node/lib
Sunday, June 05, 2011
Building node.js on Solaris 10
Constantly on the search for new tools and technologies to play with, I wanted to actually try out Node.js on my own machine.
I'm running Solaris 10 (x86), and it didn't quite work out first time. But it was pretty trivial to fix. A couple of tweaks to the configure invocation and a simple patch to make things like
So, to build Node on Solaris 10 x86:
First download node-0.4.8 and my node patch. (Yes, the patch to V8 is ugly, and it's likely to be specific to the V8 version and the Solaris rev and gcc version. And don't expect Node or V8 to work on sparc at all.)
Unpack node and apply the patch:
Then configure and build:
Replacing /opt/Node with wherever you want to install it. (Somewhere you have permission to write to, obviously.)
You then want to install npm. You will need to have curl for this, although I recommend downloading the install.sh and running it by hand, like so:
This way, it uses the correct version of tar and uses a compatible shell. (It actually invokes curl in the script, so you still need curl installed. That's not hard, or you can find one on the Companion CD.)
To actually use npm you need to continue with the tweaks. For example:
I'm running Solaris 10 (x86), and it didn't quite work out first time. But it was pretty trivial to fix. A couple of tweaks to the configure invocation and a simple patch to make things like
isnan and signbit work with a vanilla Solaris 10 install.So, to build Node on Solaris 10 x86:
First download node-0.4.8 and my node patch. (Yes, the patch to V8 is ugly, and it's likely to be specific to the V8 version and the Solaris rev and gcc version. And don't expect Node or V8 to work on sparc at all.)
Unpack node and apply the patch:
gzcat node-v0.4.8.tar.gz | gtar xf -
gpatch -p0 -i node-v0.4.8.soldiff
Then configure and build:
env CFLAGS=-std=gnu99 ./configure --prefix=/opt/Node --without-ssl
gmake -j 8
gmake install
Replacing /opt/Node with wherever you want to install it. (Somewhere you have permission to write to, obviously.)
You then want to install npm. You will need to have curl for this, although I recommend downloading the install.sh and running it by hand, like so:
env PATH=/opt/Node/bin:$PATH TAR=gtar bash install.sh
This way, it uses the correct version of tar and uses a compatible shell. (It actually invokes curl in the script, so you still need curl installed. That's not hard, or you can find one on the Companion CD.)
To actually use npm you need to continue with the tweaks. For example:
or, if you want it to install express into the Node tree rather than "." you'll need something like:
env PATH=/opt/Node/bin:$PATH TAR=gtar npm install express
env PATH=/opt/Node/bin:$PATH TAR=gtar npm install -g express
Tuesday, May 31, 2011
The trouble with tabs (in Firefox 4)
I use my web browser a lot. And I mean, a lot. (It's not that I necessarily want to, but the browser seems to have killed off a lot of proper applications, and the world is a poorer place for that.)
I've actually switched to Firefox 4. (OK, on Solaris you don't actually have all that much choice.) But normally it takes me very much longer to update to a newly released version of Firefox. Why the move this time? Primarily performance - I've found that some sites (and I suspect Twitter here) can make the whole browser feel sluggish. Certainly since I switched to version 4 the annoying lags I used to have are gone.
There are a few changes in Firefox 4 that really can't be described as anything but negative. That's my opinion, of course, but I'm a heavy user and it has really irked me that for the last couple of decades we've matched advances in computing with compensating steps backward.
The first thing that didn't actually bother me initially but soon got spectacularly irritating was the new "Tabs on Top" feature. (Ahem, misfeature.) What this really means is that the tabs for a page are separated from the page they apply to by a couple of tool bars (in my case, the Bookmarks toolbar and the Navigation toolbar). This makes the user suffer thrice: the interface appears to put the toolbars into the tabs, causing confusion; separation on screen causes a mental disconnect between the page and its tab; and you have to move the mouse further to get to the tabs, making them harder to use. Fortunately you can turn this off pretty easily by right-clicking (on the home button for example) and unchecking the option.
Far worse (because it can't just be turned off) is the switch to tab feature. So you want to open a site, you start typing its address and it appears in the dropdown list. Only if you've already got it open, you don't get to open it, you get to switch to tab - so the browser just goes to the already existing tab. Now, listen people: if I wanted to go to the tab I had already had open, guess what? I would have clicked on the tab! The fact that I'm entering it again means that I absolutely want a new copy. This behaviour is especially annoying when the tab is in another window on another virtual desktop, because it then brings that up (moving the Firefox window to a different virtual desktop in the process). Fortunately there's an add-on to disable this particular misfeature.
Browsing in tabs was a spectacularly useful advance, adding extra scalability to the browsing experience. Firefox 4 attempts to make them less usable; fortunately I've been able to sidestep that (for now).
I've actually switched to Firefox 4. (OK, on Solaris you don't actually have all that much choice.) But normally it takes me very much longer to update to a newly released version of Firefox. Why the move this time? Primarily performance - I've found that some sites (and I suspect Twitter here) can make the whole browser feel sluggish. Certainly since I switched to version 4 the annoying lags I used to have are gone.
There are a few changes in Firefox 4 that really can't be described as anything but negative. That's my opinion, of course, but I'm a heavy user and it has really irked me that for the last couple of decades we've matched advances in computing with compensating steps backward.
The first thing that didn't actually bother me initially but soon got spectacularly irritating was the new "Tabs on Top" feature. (Ahem, misfeature.) What this really means is that the tabs for a page are separated from the page they apply to by a couple of tool bars (in my case, the Bookmarks toolbar and the Navigation toolbar). This makes the user suffer thrice: the interface appears to put the toolbars into the tabs, causing confusion; separation on screen causes a mental disconnect between the page and its tab; and you have to move the mouse further to get to the tabs, making them harder to use. Fortunately you can turn this off pretty easily by right-clicking (on the home button for example) and unchecking the option.
Far worse (because it can't just be turned off) is the switch to tab feature. So you want to open a site, you start typing its address and it appears in the dropdown list. Only if you've already got it open, you don't get to open it, you get to switch to tab - so the browser just goes to the already existing tab. Now, listen people: if I wanted to go to the tab I had already had open, guess what? I would have clicked on the tab! The fact that I'm entering it again means that I absolutely want a new copy. This behaviour is especially annoying when the tab is in another window on another virtual desktop, because it then brings that up (moving the Firefox window to a different virtual desktop in the process). Fortunately there's an add-on to disable this particular misfeature.
Browsing in tabs was a spectacularly useful advance, adding extra scalability to the browsing experience. Firefox 4 attempts to make them less usable; fortunately I've been able to sidestep that (for now).
Saturday, May 28, 2011
JKstat and KAR - JSON migration
There are a couple of new updates for JKstat and KAR.
For JKstat, version 0.45 brings in JSON support, and 0.50 solidifies it.
For KAR, version 0.6.5 likewise introduces JSON support, and 0.7 makes JSON the only supported data format, superseding KAR's private data format.
The only point of 0.6.5 is that it can both read and write in both the old KAR format and the new JSON format. So I needed that in order to be able to convert old KAR archives.
I've covered some of the advantages of JSON previously. While those were just early thoughts, subsequent tests confirm the advantages of using JSON for both the client-server communication and the KAR archive format. So these releases represent both a transition and a clean break (which is why there are two new versions of each).
Now I've got JSON format data available, I'm learning javascript so as to write a browser-based client. Stay tuned.
For JKstat, version 0.45 brings in JSON support, and 0.50 solidifies it.
For KAR, version 0.6.5 likewise introduces JSON support, and 0.7 makes JSON the only supported data format, superseding KAR's private data format.
The only point of 0.6.5 is that it can both read and write in both the old KAR format and the new JSON format. So I needed that in order to be able to convert old KAR archives.
I've covered some of the advantages of JSON previously. While those were just early thoughts, subsequent tests confirm the advantages of using JSON for both the client-server communication and the KAR archive format. So these releases represent both a transition and a clean break (which is why there are two new versions of each).
Now I've got JSON format data available, I'm learning javascript so as to write a browser-based client. Stay tuned.
Sunday, May 15, 2011
About time to modernize Java
It's about time to modernize Java.
I'm not talking fancy things like closures or functional programming. I'm talking some of the basic interfaces in commonly used classes.
Exhibit A are the constructors for
Exhibit B are classes that still return
I could go on, but I think you get the point - many of Java's own classes simply haven't been modernized to bring them in line with improvements elsewhere. And I get really irritated having to continue to write crufty old-fashioned code to deal with those deficiencies.
I'm not talking fancy things like closures or functional programming. I'm talking some of the basic interfaces in commonly used classes.
Exhibit A are the constructors for
JTree and JList. These take a Hashtable and a Vector. How long have we had Collections built into Java? So why don't JTree and JList use Map and List?Exhibit B are classes that still return
Enumeration. For example, to get the contents of a ZipFile you get an Enumeration and have to work your way through it by hand. Now Java has the enhanced for-loop, there ought to be methods for returning a Collection directly.I could go on, but I think you get the point - many of Java's own classes simply haven't been modernized to bring them in line with improvements elsewhere. And I get really irritated having to continue to write crufty old-fashioned code to deal with those deficiencies.
Saturday, May 14, 2011
JSON meets JKstat and KAR
I've been looking at JSON for a long time, wondering whether and how to best make use of it. After considerable experimentation, I'm convinced, and it's going to be an integral part of both JKstat and KAR.
So, the first thing I was looking at was the client-server code in JKstat. One of the things that's always irritated me about XML-RPC is it's obvious lack of a long data type. It doesn't seem to be bothered that the world is more than 32-bits. Sure, there are various vendor extensions (and I have to turn them on in the Apache XML-RPC implementation that I use) but the result is something that's horribly non-portable.
The other thing I've been looking at is the archive format used in KAR. I started out with simple
So, enter JSON. It turns out that it makes an excellent serialization format for kstats.
As a result, the next versions of JKstat and KAR will support JSON as their archive and interchange format.
As an aside, this opens the door to wicked cool stuff.
So, the first thing I was looking at was the client-server code in JKstat. One of the things that's always irritated me about XML-RPC is it's obvious lack of a long data type. It doesn't seem to be bothered that the world is more than 32-bits. Sure, there are various vendor extensions (and I have to turn them on in the Apache XML-RPC implementation that I use) but the result is something that's horribly non-portable.
The other thing I've been looking at is the archive format used in KAR. I started out with simple
kstat -p but that proved inadequate in that important data (metadata) was missing, so I developed a private format. This was better, but was a horrid hack.So, enter JSON. It turns out that it makes an excellent serialization format for kstats.
- Reusing a standard means there's less work for me to do.
- I can use the same code for KAR and the JKstat client-server mode.
- There are JSON bindings in almost all languages, so interoperability is easy to achieve.
- The format is a string, so no messing about with extensions to pass longs.
- For KAR, it's almost twice as quick to parse as my own hacked format.
As a result, the next versions of JKstat and KAR will support JSON as their archive and interchange format.
As an aside, this opens the door to wicked cool stuff.
Tuesday, May 03, 2011
SolView 0.56
Hot on the heels of an updated JKstat comes a new release of SolView.
Like with JKstat, there's a lot of tidying up and quite a bit of extra polish. Little things, like changing some of the label text to make it more meaningful, or telling you if a disk or partition is part of a ZFS pool.
There's one fairly visible change, to the start of the explorer view, which now looks very different:

This is getting closer to what I envisioned early on for this view, a much more graphically rich presentation. It's not finished, and what's shown (and how) will certainly change, but it shows the direction I would like to head in.
Like with JKstat, there's a lot of tidying up and quite a bit of extra polish. Little things, like changing some of the label text to make it more meaningful, or telling you if a disk or partition is part of a ZFS pool.
There's one fairly visible change, to the start of the explorer view, which now looks very different:

This is getting closer to what I envisioned early on for this view, a much more graphically rich presentation. It's not finished, and what's shown (and how) will certainly change, but it shows the direction I would like to head in.
Monday, May 02, 2011
JKstat 0.44
It's been one day off work after another here in the UK recently. In between going to a beer festival and Newmarket races, I've found a little time to work on JKstat.
The result is a new version of JKstat available for download.
There's nothing earth shattering here, but a process of steady improvement. I've gone through the demos, removing some of the cruftier ones, enhancing some of the others, and moving some of those from SolView back to JKstat. So, the original iostat demo has gone, leaving just the table-based version; the load subcommand has been replaced by an uptime subcommand. The cpustate demo has been merged with the cpuchart demo, and has also had a vertical mode added.
 OK, so it's not that impressive on my little desktop machine, but it works much better than the old layout as a display arrangement on something like a T5140 that has 128 cpus in it.
There's additional polish elsewhere. Apart from fewer typos, I've filtered out kstats from the chartbuilder that you'll never want to chart, so there are fewer kstats to munge through. The charts work a little better too: they now display the statistics in the requested order, and you can set the colors.
Another thing I've been playing with is an 'interesting' subcommand that tries to identify kstats with interesting behaviour - as in doing something out of the ordinary. This worked out a whole lot worse than I hoped. The problem, of course, is defining what constitutes normal (let alone anomalous) behaviour. The behaviour of any kstat certainly isn't normally distributed, and in fact many are very spiky as a matter of course. I may revisit this with KAR, which has historical data from which I can construct a baseline of the expected range of behaviour.
Something else I've been looking at is sparklines. I added a simple line graph to JStripChart to support this. At the moment they're not really sparklines, just little graphs, but it's a start, and expect to see more of that in SolView.
There's also a stunningly boneheaded bug fixed in KstatFilter. Filtering out things you don't want was matching far too much (it would match any of a module:instance:name specifier rather than the correct behaviour of matching all of them, so unix:0:kstat_types would throw away all unix kstats and all of instance 0, which wasn't what you wanted).
The result is a new version of JKstat available for download.
There's nothing earth shattering here, but a process of steady improvement. I've gone through the demos, removing some of the cruftier ones, enhancing some of the others, and moving some of those from SolView back to JKstat. So, the original iostat demo has gone, leaving just the table-based version; the load subcommand has been replaced by an uptime subcommand. The cpustate demo has been merged with the cpuchart demo, and has also had a vertical mode added.
 OK, so it's not that impressive on my little desktop machine, but it works much better than the old layout as a display arrangement on something like a T5140 that has 128 cpus in it.
There's additional polish elsewhere. Apart from fewer typos, I've filtered out kstats from the chartbuilder that you'll never want to chart, so there are fewer kstats to munge through. The charts work a little better too: they now display the statistics in the requested order, and you can set the colors.
Another thing I've been playing with is an 'interesting' subcommand that tries to identify kstats with interesting behaviour - as in doing something out of the ordinary. This worked out a whole lot worse than I hoped. The problem, of course, is defining what constitutes normal (let alone anomalous) behaviour. The behaviour of any kstat certainly isn't normally distributed, and in fact many are very spiky as a matter of course. I may revisit this with KAR, which has historical data from which I can construct a baseline of the expected range of behaviour.
Something else I've been looking at is sparklines. I added a simple line graph to JStripChart to support this. At the moment they're not really sparklines, just little graphs, but it's a start, and expect to see more of that in SolView.
There's also a stunningly boneheaded bug fixed in KstatFilter. Filtering out things you don't want was matching far too much (it would match any of a module:instance:name specifier rather than the correct behaviour of matching all of them, so unix:0:kstat_types would throw away all unix kstats and all of instance 0, which wasn't what you wanted).
Friday, April 29, 2011
Nudging the Narwhal
As is customary with any Ubuntu release, I downloaded the recently released 11.04 and took it for a spin.
The installation started off well. I liked the fact that it got started on the install and then asked you the configuration questions, minimizing the overall install time. And it looked like the install was galloping along. Then it bogged down, and got slower and slower. Made a coffee. Drank the coffee. Install going nowhere fast. Checked the Royal wedding pictures, played a few ZX spectrum games. Install going nowhere fast. Updated a slew of other applications on my Solaris box. Install going nowhere fast. Finally, after over an hour, it finishes the install. That was gruesome.
After installing the guest additions for VirtualBox I got the new Unity interface. And it's not all that bad. It's not that good either, but I didn't get the horribly negative reaction to it that many have reported. In a lot of usage scenarios, I can see it working just fine.
So, what does Unity get you? Well, it works pretty well for simple task-based computing. If you just have a handful of applications that you use, and you only use one at a time, then it works great. It allows you to focus on the task at hand. It starts to struggle if you're multitasking or if you need to do a lot of different things because once you're outside the simple task metaphor it really struggles.
Is Unity radical? Not really. I've used dozens of desktop interfaces. So this one has panels on the left and top rather than placed elsewhere, but that's no big deal. The window controls have moved, but that's trivial. Seriously, there's nothing much new here.
The problems I have with Unity are really that it doesn't fit my normal working style (which tends to involve having huge numbers of applications open, often many windows of the same application). The launcher on the left only really scales up to a dozen applications or so; beyond that it becomes cumbersome. It folds up whatever's at the bottom of the list in the normal view, but expands things out (forcing the launcher to scroll) if you use the folded-up applications. And you can't clean things up by moving your applications across multiple virtual desktops - you get to see all the launcher items all the time, rather than just the ones relevant to the desktop you're on.
Dealing with multiple instances of the same application works really badly. There's no good way to organise 100 xterms, for instance. Double-click on the xterm launcher icon and they're sitting there in a 10x10 grid. But which one's which? Again, sorting them by virtual desktop doesn't really help. And right-click on the launcher icon gets you a menu, including quit - which quits all of them.
Another major change is the move of the application toolbar to the top of the screen. I hate this for two reasons: for one, it means you have to mouse all the way across the screen, and for two, it interacts really badly with a mouse focus policy of focus-follows-mouse. Fortunately, I tend not to use application menus very much.
None of the criticisms are necessarily aimed directly at Unity, of course. It's more that it has changed to a new usage paradigm, but all the rest of the desktop and all the applications haven't, and the mismatch shows pretty clearly. What would be really interesting to see would be what Unity would be like with applications designed around it, rather than with all the (legacy, for it) applications we have today.
The installation started off well. I liked the fact that it got started on the install and then asked you the configuration questions, minimizing the overall install time. And it looked like the install was galloping along. Then it bogged down, and got slower and slower. Made a coffee. Drank the coffee. Install going nowhere fast. Checked the Royal wedding pictures, played a few ZX spectrum games. Install going nowhere fast. Updated a slew of other applications on my Solaris box. Install going nowhere fast. Finally, after over an hour, it finishes the install. That was gruesome.
After installing the guest additions for VirtualBox I got the new Unity interface. And it's not all that bad. It's not that good either, but I didn't get the horribly negative reaction to it that many have reported. In a lot of usage scenarios, I can see it working just fine.
So, what does Unity get you? Well, it works pretty well for simple task-based computing. If you just have a handful of applications that you use, and you only use one at a time, then it works great. It allows you to focus on the task at hand. It starts to struggle if you're multitasking or if you need to do a lot of different things because once you're outside the simple task metaphor it really struggles.
Is Unity radical? Not really. I've used dozens of desktop interfaces. So this one has panels on the left and top rather than placed elsewhere, but that's no big deal. The window controls have moved, but that's trivial. Seriously, there's nothing much new here.
The problems I have with Unity are really that it doesn't fit my normal working style (which tends to involve having huge numbers of applications open, often many windows of the same application). The launcher on the left only really scales up to a dozen applications or so; beyond that it becomes cumbersome. It folds up whatever's at the bottom of the list in the normal view, but expands things out (forcing the launcher to scroll) if you use the folded-up applications. And you can't clean things up by moving your applications across multiple virtual desktops - you get to see all the launcher items all the time, rather than just the ones relevant to the desktop you're on.
Dealing with multiple instances of the same application works really badly. There's no good way to organise 100 xterms, for instance. Double-click on the xterm launcher icon and they're sitting there in a 10x10 grid. But which one's which? Again, sorting them by virtual desktop doesn't really help. And right-click on the launcher icon gets you a menu, including quit - which quits all of them.
Another major change is the move of the application toolbar to the top of the screen. I hate this for two reasons: for one, it means you have to mouse all the way across the screen, and for two, it interacts really badly with a mouse focus policy of focus-follows-mouse. Fortunately, I tend not to use application menus very much.
None of the criticisms are necessarily aimed directly at Unity, of course. It's more that it has changed to a new usage paradigm, but all the rest of the desktop and all the applications haven't, and the mismatch shows pretty clearly. What would be really interesting to see would be what Unity would be like with applications designed around it, rather than with all the (legacy, for it) applications we have today.
Thursday, February 24, 2011
JProc 0.6
A little more tinkering, and an updated version of JProc is now available.
The primary addition in this release is that I've implemented access to the
The primary addition in this release is that I've implemented access to the
prusage struct, both for processes and threads. There's a new usage subcommand that shows prusage data in a table for processes. And, if you right-click in the info or usage display, you can display a breakdown of usage by thread.
Sunday, February 06, 2011
Pushing kar along
I updated KAR recently.
This follows my recent philosophy that code and bugs are the same thing, although I hope that each version squishes some bugs as well as introducing them.
Most of the bugs fixed this time were as a direct result of trying to use kar for real, generating graphs of system activity to answer question for users, developers, and management. In some cases, kar just gave up or gave the wrong data.
(A particularly insidious bug lies in the use of printf in C. You have to specify exactly the type and size of a variable. If the type you print and the actual storage type don't match, bad things can happen. Worse, different processor architectures behave in different ways. Printing a 64-bit value as 32-bit appears to work on an Opteron box, but fails miserably on a SPARC.)
One thing I'm actually doing is using kar's print subcommand to output the data, and then munging the data before feeding it into something like ploticus to do the actual plotting. The inbuilt chart support works well for predefined charts, but I often want something slightly different.
This follows my recent philosophy that code and bugs are the same thing, although I hope that each version squishes some bugs as well as introducing them.
Most of the bugs fixed this time were as a direct result of trying to use kar for real, generating graphs of system activity to answer question for users, developers, and management. In some cases, kar just gave up or gave the wrong data.
(A particularly insidious bug lies in the use of printf in C. You have to specify exactly the type and size of a variable. If the type you print and the actual storage type don't match, bad things can happen. Worse, different processor architectures behave in different ways. Printing a 64-bit value as 32-bit appears to work on an Opteron box, but fails miserably on a SPARC.)
One thing I'm actually doing is using kar's print subcommand to output the data, and then munging the data before feeding it into something like ploticus to do the actual plotting. The inbuilt chart support works well for predefined charts, but I often want something slightly different.
Monday, January 24, 2011
Code = bugs
I've come to the conclusion that all code is buggy, often hideously so.
This isn't necessarily an observation on other people's code. My code is perfect. Ha! Only it's not, of course.
Something like JKstat is reasonably mature and (I thought) reasonably well tested. But the latest release fixes a number of pretty basic numbskull bugs that had been sitting there for ages.
I place a lot of emphasis on code quality. I use jstyle (part of the Solaris ON build environment) to enforce a programming style. Enforcing consistency makes the code more readable, and this style is one that my eyes (and my typing fingers) are comfortable with. I use PMD to automatically check for basic errors and obvious code deficiencies. When I first started using PMD, it found lots of basic errors. What it doesn't catch are the doofus logic errors that my brain introduces.
For Java programming, I found Generics to be a great benefit. Java is a strongly typed language, but a major structural part of the language - the Collections framework - didn't impose any type safety at all. Everything was just an untyped Object. Whilst Generics adds type-safety, and the enhanced for-loop often precisely expresses your intentions (as opposed to looping over an array index), I found that adding Generics made be think about the types of object I was putting in my collections, which was one step in thinking more about the structure of the code itself.
Occasionally, I get to look at code written by others. Now, often, open source code isn't actually too bad - there's often a fixed style adopted by a community, and multiple authors can eliminate some of the more bizarre excursions into code obfuscation. But some of the code I get to see in the office truly horrifies me. Invariably without useful comments, with all the old code still in the source file but inactive, and as many different styles as we've had people work on the code (often in a language they're not entirely fluent in), just hacked in to the point where it would work with no attempt (because there's no money in this) to go back and improve maintainability of the code for the next person.
One of the problems is the languages themselves. Java is strongly typed (I like this, because it makes simple typing errors into compile failures which are obvious), but requires massive levels of boilerplate. I dislike the use of an IDE, because I want to feel comfortable with every line of code I write. So you're wedged in to a place where just feeding the IDE, or writing boilerplate code, takes far too many brain cycles away from actually implementing real functionality.
So change languages, you say! Well, I actually try and learn one new language (or a major area of a language) each year. So I wrote a monitoring application in tcl/tk once, then rewrote it as a webapp using JSP, then rewrote it to do graphics using Java2D, and then rewrote it in PHP, just so I could learn those languages. After several attempts, though, I have completely failed to acquire any significant competence in Python.
Something I have been looking at recently (after an excellent talk at the local Cambridge Java Meetup group) is Clojure. You may find this a bit of an odd choice, but hacking on lisp for emacs many years ago makes it moderately familiar, and being built on the JVM means that I may be able to leverage other skills.
Which leads to a question: what programming language (or skill) have you learnt this year?
This isn't necessarily an observation on other people's code. My code is perfect. Ha! Only it's not, of course.
Something like JKstat is reasonably mature and (I thought) reasonably well tested. But the latest release fixes a number of pretty basic numbskull bugs that had been sitting there for ages.
I place a lot of emphasis on code quality. I use jstyle (part of the Solaris ON build environment) to enforce a programming style. Enforcing consistency makes the code more readable, and this style is one that my eyes (and my typing fingers) are comfortable with. I use PMD to automatically check for basic errors and obvious code deficiencies. When I first started using PMD, it found lots of basic errors. What it doesn't catch are the doofus logic errors that my brain introduces.
For Java programming, I found Generics to be a great benefit. Java is a strongly typed language, but a major structural part of the language - the Collections framework - didn't impose any type safety at all. Everything was just an untyped Object. Whilst Generics adds type-safety, and the enhanced for-loop often precisely expresses your intentions (as opposed to looping over an array index), I found that adding Generics made be think about the types of object I was putting in my collections, which was one step in thinking more about the structure of the code itself.
Occasionally, I get to look at code written by others. Now, often, open source code isn't actually too bad - there's often a fixed style adopted by a community, and multiple authors can eliminate some of the more bizarre excursions into code obfuscation. But some of the code I get to see in the office truly horrifies me. Invariably without useful comments, with all the old code still in the source file but inactive, and as many different styles as we've had people work on the code (often in a language they're not entirely fluent in), just hacked in to the point where it would work with no attempt (because there's no money in this) to go back and improve maintainability of the code for the next person.
One of the problems is the languages themselves. Java is strongly typed (I like this, because it makes simple typing errors into compile failures which are obvious), but requires massive levels of boilerplate. I dislike the use of an IDE, because I want to feel comfortable with every line of code I write. So you're wedged in to a place where just feeding the IDE, or writing boilerplate code, takes far too many brain cycles away from actually implementing real functionality.
So change languages, you say! Well, I actually try and learn one new language (or a major area of a language) each year. So I wrote a monitoring application in tcl/tk once, then rewrote it as a webapp using JSP, then rewrote it to do graphics using Java2D, and then rewrote it in PHP, just so I could learn those languages. After several attempts, though, I have completely failed to acquire any significant competence in Python.
Something I have been looking at recently (after an excellent talk at the local Cambridge Java Meetup group) is Clojure. You may find this a bit of an odd choice, but hacking on lisp for emacs many years ago makes it moderately familiar, and being built on the JVM means that I may be able to leverage other skills.
Which leads to a question: what programming language (or skill) have you learnt this year?
New year, new JKstat
I've been quietly working on JKstat, and have just released another update, version 0.43.
I wasn't actually aiming to cut a release at this point, there are still a couple of things I'm working on. But I needed to get some fixes into KAR, and didn't want to push out a KAR release with an unreleased version of JKstat in it, hence a synchronization release.
Realistically, JKstat has largely stabilized. So it's more a case of fixing odd bugs (the network load demo wouldn't display anything if you resized it, and guessed the network speed wrong), adding features like stepping backwards in the browser when reading KAR data, and cleaning up the javadoc. Little features like keeping all the statistics underneath a chart, so that when you add another statistic to be graphed it shows the historical data rather than starting from the current time. Nothing earth-shattering, but (hopefully) making JKstat better.
I wasn't actually aiming to cut a release at this point, there are still a couple of things I'm working on. But I needed to get some fixes into KAR, and didn't want to push out a KAR release with an unreleased version of JKstat in it, hence a synchronization release.
Realistically, JKstat has largely stabilized. So it's more a case of fixing odd bugs (the network load demo wouldn't display anything if you resized it, and guessed the network speed wrong), adding features like stepping backwards in the browser when reading KAR data, and cleaning up the javadoc. Little features like keeping all the statistics underneath a chart, so that when you add another statistic to be graphed it shows the historical data rather than starting from the current time. Nothing earth-shattering, but (hopefully) making JKstat better.
Friday, December 03, 2010
SNMP gets slightly easier
A new version of my Java SNMP viewer Jangle is now available.
One thing I've wanted to do is automatically build relationships. There are two tabs in the Jangle display that do this automatically, showing Siblings and Cousins.
The Siblings tab shows attributes that share a common parent. Due to the way that SNMP works, this means different instances of the same thing. For example, if you're interested in ifInOctets, then this will have an entry for each interface - ifInOctets.1, ifInOctets.2, ifInOctets.3 and so on. So the Siblings display will put all these on one graph for you.
What if you're just interested in all the attributes of a particular interface? Given ifInOctets.2, you want ifOutOctets.2 and the like? That's where the Cousins tab comes in - it will show (and graph) all these related attributes for you. (Of course, while Cousins is an appropriate term in the sense that the other attributes are children of your parents siblings, it's also only a specific subset of those Cousins. It would be nice to come up with a better term.)
It's relatively trivial to build these relationships automatically - the OID tree is structured to make it possible. They also answer the questions I tend to ask most often. Building more complex relationships will likely have to be done by hand, and require domain-specific knowledge.
This was relatively easy to code up, with just a little twist. When you select a new OID to display, it starts all the graphs from scratch again. What I also wanted to be sure of was that if the new OID was a sibling or cousin of the one already being shown, then it would keep the existing sibling or cousin graph rather than reset it.
One thing I've wanted to do is automatically build relationships. There are two tabs in the Jangle display that do this automatically, showing Siblings and Cousins.
The Siblings tab shows attributes that share a common parent. Due to the way that SNMP works, this means different instances of the same thing. For example, if you're interested in ifInOctets, then this will have an entry for each interface - ifInOctets.1, ifInOctets.2, ifInOctets.3 and so on. So the Siblings display will put all these on one graph for you.
What if you're just interested in all the attributes of a particular interface? Given ifInOctets.2, you want ifOutOctets.2 and the like? That's where the Cousins tab comes in - it will show (and graph) all these related attributes for you. (Of course, while Cousins is an appropriate term in the sense that the other attributes are children of your parents siblings, it's also only a specific subset of those Cousins. It would be nice to come up with a better term.)
It's relatively trivial to build these relationships automatically - the OID tree is structured to make it possible. They also answer the questions I tend to ask most often. Building more complex relationships will likely have to be done by hand, and require domain-specific knowledge.
This was relatively easy to code up, with just a little twist. When you select a new OID to display, it starts all the graphs from scratch again. What I also wanted to be sure of was that if the new OID was a sibling or cousin of the one already being shown, then it would keep the existing sibling or cousin graph rather than reset it.
Monday, November 22, 2010
KAR at LOSUG
Last Wednesday I gave a short talk about KAR at LOSUG.
Apart from the fact that my laptop and the projector refused to get along, it went OK. That disagreement meant that the interactive show and tell (aka the demo) got skipped, but that was always designed as an extra. I hope I got people thinking - the real aim here is to try and make people think about what we do, rather than spoonfeed solutions to them (that's what marketing is for).
For the talk I released a new version of KAR, and in preparing the talk and getting some things ready I stumbled across one or two issues I thought worthy of further fixes.
Part of this is my implementation, but using JKstat to parse the KAR archives has never been exactly quick. Several minutes for a full day's data from a decent server. My original implementation of graph generation involved doing that for every graph - so generating the 100+ graphs took rather a long time.
Here follows a completely gratuitous graph: network traffic on my home machine over the course of a day.

The parser in JKstat was only partially finished, so I tidied it up a bit. It now caches parsed data, and allows consumers to step backwards as well as forwards, and rewind, and the cache is shared across multiple instances. This allows you to just parse the data once and then analyze it to your heart's content. What this means is that generating all the graphs takes only a little longer than generating the first one - making it 100 times faster.
(Which proves the point: fixing truly stupid implementations can give you huge performance gains. There is no way I can imagine getting a hundred-fold performance improvement by tweaking the parser. That's not to say I'm happy with performance now - far from it - but it's made one particular common task viable, which it wasn't before.)
So, a new release of both KAR and JKstat is now available.
The next step for KAR is to identify additional measurements that would be generally useful, and then add them to the list of graphs generated (and maybe have specific utilities for specific data).
Apart from the fact that my laptop and the projector refused to get along, it went OK. That disagreement meant that the interactive show and tell (aka the demo) got skipped, but that was always designed as an extra. I hope I got people thinking - the real aim here is to try and make people think about what we do, rather than spoonfeed solutions to them (that's what marketing is for).
For the talk I released a new version of KAR, and in preparing the talk and getting some things ready I stumbled across one or two issues I thought worthy of further fixes.
Part of this is my implementation, but using JKstat to parse the KAR archives has never been exactly quick. Several minutes for a full day's data from a decent server. My original implementation of graph generation involved doing that for every graph - so generating the 100+ graphs took rather a long time.
Here follows a completely gratuitous graph: network traffic on my home machine over the course of a day.

The parser in JKstat was only partially finished, so I tidied it up a bit. It now caches parsed data, and allows consumers to step backwards as well as forwards, and rewind, and the cache is shared across multiple instances. This allows you to just parse the data once and then analyze it to your heart's content. What this means is that generating all the graphs takes only a little longer than generating the first one - making it 100 times faster.
(Which proves the point: fixing truly stupid implementations can give you huge performance gains. There is no way I can imagine getting a hundred-fold performance improvement by tweaking the parser. That's not to say I'm happy with performance now - far from it - but it's made one particular common task viable, which it wasn't before.)
So, a new release of both KAR and JKstat is now available.
The next step for KAR is to identify additional measurements that would be generally useful, and then add them to the list of graphs generated (and maybe have specific utilities for specific data).
Thursday, October 28, 2010
AfterStep, piewm, tvtwm, and friends
Following on from earlier work, I've made available some AfterStep packages for Solaris.
Then, I tried some of the twm variants. I started with ctwm and vtwm, and then moved on to tvtwm and piewm. Then I hit a problem - piewm didn't work. It was choking somewhere in the lex parser, so refusing to load any config, so no menus or anything. It's based on a older version of tvtwm and, rather than attempt to learn lex and fix that, I had a go at simply adding the pie menu support to the latest version of tvtwm (tvtwm-pl11), and that turned out to be pretty easy.
So my merged source, boringly named ptvtwm, is available from here, as are the usual Solaris packages. The packages include piewm and tvtwm derived from ptvtwm, as well as ctwm and vtwm, along with a private copy of xli so that tvtwm/piewm can load a background picture.
That's quite a lot of Window managers, so I've put together a list of package window managers.
That's essentially it for now. I'm hoping to get Xfce packaged up, but there are a fair number of prerequisites that Solaris doesn't have (or has antiquated versions of) so the packages end up being pretty huge. I'll get there, but haven't yet got a build I'm happy to let out.
Then, I tried some of the twm variants. I started with ctwm and vtwm, and then moved on to tvtwm and piewm. Then I hit a problem - piewm didn't work. It was choking somewhere in the lex parser, so refusing to load any config, so no menus or anything. It's based on a older version of tvtwm and, rather than attempt to learn lex and fix that, I had a go at simply adding the pie menu support to the latest version of tvtwm (tvtwm-pl11), and that turned out to be pretty easy.
So my merged source, boringly named ptvtwm, is available from here, as are the usual Solaris packages. The packages include piewm and tvtwm derived from ptvtwm, as well as ctwm and vtwm, along with a private copy of xli so that tvtwm/piewm can load a background picture.
That's quite a lot of Window managers, so I've put together a list of package window managers.
That's essentially it for now. I'm hoping to get Xfce packaged up, but there are a fair number of prerequisites that Solaris doesn't have (or has antiquated versions of) so the packages end up being pretty huge. I'll get there, but haven't yet got a build I'm happy to let out.
Thursday, October 21, 2010
Old and New
A couple of window managers packaged up for Solaris this week.
First, some solaris packages for the pekwm window manager. This pretty much scores a bullseye when it comes to minimalism, and is still being developed.
Go back 20 years, and I've built some awm packages. Now the Ardent Window Manager wasn't the first I ever used, but I spent about 2 years working with it, and it was pretty good. Highly flexible and customizable, in the true style of the time - you open up the config file in your favourite editor and make it do whatever you want.
Now, I had to make a tiny number of code changes to get it to compile, but only a tiny number, and all pretty trivial. And it works just fine, even if it does have a bit of a retro look to it.
First, some solaris packages for the pekwm window manager. This pretty much scores a bullseye when it comes to minimalism, and is still being developed.
Go back 20 years, and I've built some awm packages. Now the Ardent Window Manager wasn't the first I ever used, but I spent about 2 years working with it, and it was pretty good. Highly flexible and customizable, in the true style of the time - you open up the config file in your favourite editor and make it do whatever you want.
Now, I had to make a tiny number of code changes to get it to compile, but only a tiny number, and all pretty trivial. And it works just fine, even if it does have a bit of a retro look to it.
Thursday, October 14, 2010
Enlightenment packages for Solaris
As I mentioned earlier when talking about Window Maker, I've been hoping to find time to get some other window managers packaged up for Solaris.
OK, so Enlightenment packages are available. Just to be clear, these are e16, not some cut of the current development branch. (I'm having a look at the EFL beta, trying to get it to work on Solaris.)
As with wmaker, these packages should install fine on Solaris 10 (some reasonably current update, anyway) and OpenSolaris/OpenIndiana. They should appear as session options on the login screen, and they should basically work. But this isn't something I use extensively, and there are almost certainly rough edges.
The packages include imlib2, e16, libast, Eterm, and themes. They all go together, so there's just the one package. This all installs directly into /usr, which is fine as there aren't any conflicts with anything that ships with Solaris.
While I like playing with shiny toys such as enlightenment, I never really got on with it - the behaviour was always slightly interesting, and I found the themes overly fussy, And speaking of themes, a whole bunch of themes for e16 are available, and a lot of those are quite polished.
OK, so Enlightenment packages are available. Just to be clear, these are e16, not some cut of the current development branch. (I'm having a look at the EFL beta, trying to get it to work on Solaris.)
As with wmaker, these packages should install fine on Solaris 10 (some reasonably current update, anyway) and OpenSolaris/OpenIndiana. They should appear as session options on the login screen, and they should basically work. But this isn't something I use extensively, and there are almost certainly rough edges.
The packages include imlib2, e16, libast, Eterm, and themes. They all go together, so there's just the one package. This all installs directly into /usr, which is fine as there aren't any conflicts with anything that ships with Solaris.
While I like playing with shiny toys such as enlightenment, I never really got on with it - the behaviour was always slightly interesting, and I found the themes overly fussy, And speaking of themes, a whole bunch of themes for e16 are available, and a lot of those are quite polished.
Tuesday, October 12, 2010
Remote Monitoring, APIs, and JMX
Recently I went along to the Cambridge Java Group. Enjoyable evening - would be great to get more people along, so if there's anybody else in Cambridge interested in Java and related technologies then do come along!
I talked about JKstat briefly, and I hope that some people found it interesting. One of the comments was along the lines of "hey, you could expose this with JMX and monitor it remotely". I had looked at JMX before, and had largely ignored it because I couldn't see an easy way to use the technology. So I tried again, putting together a bean interface and implementation, and a simple server.
I pointed jconsole at it, and it works. I can see the data I exposed there in jconsole. So, that proves that my code works. But is that it? After all, jconsole can do some quite sophisticated monitoring of a JVM, and give pretty graphs. But there seems to be a fair amount of domain-specific knowledge that has gone into that, which is hard-coded into the client. And I really don't want to write (yet another) client interface - the whole point is to leverage what is claimed to be considerable investment in JMX tooling.
This investment must be kept locked safely away. I've had a look around, and really can't see much in the way of fully functional general-purpose JMX clients. (Here's a list.)
Of course, I've been here before. I ended up writing my own SNMP client because I couldn't find anything else that did what I wanted. I really don't want to do the same for JMX.
So, a question: what do people use for monitoring that uses JMX? How valuable is it?
Of course, you wouldn't actually set up a JMX server and client specifically for accessing JKstat. That would be silly. After all, JKstat comes with a fully functional client-server mode that exposes all the data you need in a reasonably efficient manner. The ideal case for using JMX would be when you had an existing system already being monitored with JMX, at which point you could simply add JKstat support to gain access to extra data without adding additional protocols or tools.
I've also been looking at other client-server technologies. One that I'll probably do (partly because it shares some framework with JMX, partly because I know how to do it anyway) is RMI. But that, like JMX, is fairly specific to Java. It would be nice to have something that was capable of communicating with, say, python (or pretty much any scripting language). You would have thought that because I had used XML-RPC then I would be able to access it from anything else using XML-RPC, but that's not the case. I needed to use extensions to get sensible type support (like the fact that much of the data is stored as a long not an int), and those aren't commonly deployed. I was, therefore, intrigued by Theo's rant which summed up my thoughts exactly, and saved me the trouble of investigating JSON, as it's clearly not up to the task either.
So many half-baked answers. Go on, somebody - tell me what I'm missing!
I talked about JKstat briefly, and I hope that some people found it interesting. One of the comments was along the lines of "hey, you could expose this with JMX and monitor it remotely". I had looked at JMX before, and had largely ignored it because I couldn't see an easy way to use the technology. So I tried again, putting together a bean interface and implementation, and a simple server.
I pointed jconsole at it, and it works. I can see the data I exposed there in jconsole. So, that proves that my code works. But is that it? After all, jconsole can do some quite sophisticated monitoring of a JVM, and give pretty graphs. But there seems to be a fair amount of domain-specific knowledge that has gone into that, which is hard-coded into the client. And I really don't want to write (yet another) client interface - the whole point is to leverage what is claimed to be considerable investment in JMX tooling.
This investment must be kept locked safely away. I've had a look around, and really can't see much in the way of fully functional general-purpose JMX clients. (Here's a list.)
Of course, I've been here before. I ended up writing my own SNMP client because I couldn't find anything else that did what I wanted. I really don't want to do the same for JMX.
So, a question: what do people use for monitoring that uses JMX? How valuable is it?
Of course, you wouldn't actually set up a JMX server and client specifically for accessing JKstat. That would be silly. After all, JKstat comes with a fully functional client-server mode that exposes all the data you need in a reasonably efficient manner. The ideal case for using JMX would be when you had an existing system already being monitored with JMX, at which point you could simply add JKstat support to gain access to extra data without adding additional protocols or tools.
I've also been looking at other client-server technologies. One that I'll probably do (partly because it shares some framework with JMX, partly because I know how to do it anyway) is RMI. But that, like JMX, is fairly specific to Java. It would be nice to have something that was capable of communicating with, say, python (or pretty much any scripting language). You would have thought that because I had used XML-RPC then I would be able to access it from anything else using XML-RPC, but that's not the case. I needed to use extensions to get sensible type support (like the fact that much of the data is stored as a long not an int), and those aren't commonly deployed. I was, therefore, intrigued by Theo's rant which summed up my thoughts exactly, and saved me the trouble of investigating JSON, as it's clearly not up to the task either.
So many half-baked answers. Go on, somebody - tell me what I'm missing!
Saturday, October 02, 2010
Window Maker
I've always experimented with different X11 window managers and desktops. There was a time when there was actually significant choice and variety, and a lot of energy to go with it.
I simply never got on with either SunView or OpenWindows, much preferring awm or tvtwm. And while CDE had some useful utilities, the desktop itself drove me to distraction. I appreciate the strengths of KDE, but can't get on with it either. I currently use either the Solaris JDS build of GNOME or a home-built version of XFCE as my primary desktop.
I spend a lot of my time living inside VNC sessions, and there I run Window Maker. I've always liked Window Maker - fast, lightweight, and there were oodles of themes available. (A theme here is a desktop background and a colour scheme for menus and window decorations.) Unfortunately availability of themes is now limited.
I've made available my own Window Maker Packages for Solaris. These include the software and integration with either dtlogin or gdm, and will work on either Solaris 10 or OpenSolaris/OpenIndiana.
Included in those packages are a couple of simple themes I've put together based on OpenSolaris and OpenIndiana, which you can also get directly from the above link if you already have Window Maker running.
I also run, at times, many of the other older styles of window managers, from the basic twm derivatives up to enlightenment and AfterStep. Hopefully I'll be able to find some time to get those properly packaged up as well.
I simply never got on with either SunView or OpenWindows, much preferring awm or tvtwm. And while CDE had some useful utilities, the desktop itself drove me to distraction. I appreciate the strengths of KDE, but can't get on with it either. I currently use either the Solaris JDS build of GNOME or a home-built version of XFCE as my primary desktop.
I spend a lot of my time living inside VNC sessions, and there I run Window Maker. I've always liked Window Maker - fast, lightweight, and there were oodles of themes available. (A theme here is a desktop background and a colour scheme for menus and window decorations.) Unfortunately availability of themes is now limited.
I've made available my own Window Maker Packages for Solaris. These include the software and integration with either dtlogin or gdm, and will work on either Solaris 10 or OpenSolaris/OpenIndiana.
Included in those packages are a couple of simple themes I've put together based on OpenSolaris and OpenIndiana, which you can also get directly from the above link if you already have Window Maker running.
I also run, at times, many of the other older styles of window managers, from the basic twm derivatives up to enlightenment and AfterStep. Hopefully I'll be able to find some time to get those properly packaged up as well.
Thursday, September 30, 2010
SolView 0.54
Actually, this was supposed to be about version 0.53 of SolView, but 0.54 has the fixed JProc which is quite handy.
Apart from that bugfix, SolView now sports a number of useful refinements.
The localprofile subcommand generates a jumpstart profile that will (approximately) match the current system. So on my desktop:
Actually, there's a little bit missing from the above, which is what another new subcommand - missingpackages - will show, namely the list of packages that should be installed to meet dependency requirements but aren't:
Now, some of those are install errors on my part (I ought to have killed all the postgres packages), but some are just due to wrong dependency data.
Continuing a bit of a theme, disks, networks interfaces, processors, packages, and clusters are sorted.
In the jumpstart profile builder there's quite a lot more polish. Version 0.52 added automatic recursive removal of packages, but the new version fixes a number of minor display issues - the checkboxes update instantly, clusters properly reflect their status if all their constituent packages are added or removed, and the profile appears automatically when you go to the profile display tab. And if you're fed up, you can start over without exiting. All in all it's now much easier to use.
Apart from that bugfix, SolView now sports a number of useful refinements.
The localprofile subcommand generates a jumpstart profile that will (approximately) match the current system. So on my desktop:
# ./solview localprofile
cluster SUNWCXall
cluster SUNWCapache delete
cluster SUNWCapch2 delete
cluster SUNWCappserver delete
cluster SUNWCbreg delete
cluster SUNWCfsmgt delete
cluster SUNWCiq delete
cluster SUNWCmcdk delete
cluster SUNWCmip delete
cluster SUNWCnet delete
cluster SUNWCpcmc delete
cluster SUNWCpgadmin3 delete
cluster SUNWCpmgr delete
cluster SUNWCpostgr delete
cluster SUNWCpostgr-82 delete
cluster SUNWCpostgr-82-dev delete
cluster SUNWCpostgr-83 delete
cluster SUNWCpostgr-83-dev delete
cluster SUNWCpostgr-dev delete
cluster SUNWCrm delete
cluster SUNWCservicetags delete
cluster SUNWCsip delete
cluster SUNWCsmap delete
cluster SUNWCsmc delete
cluster SUNWCsppp delete
cluster SUNWCswup delete
cluster SUNWCtcat delete
cluster SUNWCwbem delete
cluster SUNWCwsdk delete
cluster SUNWCxmft delete
cluster SUNWCzebra delete
package SK98sol delete
package SKfp delete
package SUNWast delete
package SUNWcnsr delete
package SUNWcnsu delete
package SUNWfac delete
package SUNWfwdc delete
package SUNWfwdcu delete
package SUNWipplr delete
package SUNWipplu delete
package SUNWjato delete
package SUNWjatodmo delete
package SUNWjatodoc delete
package SUNWjsnmp delete
package SUNWluzone delete
package SUNWlvma delete
package SUNWlvmg delete
package SUNWmcon delete
package SUNWmcos delete
package SUNWmcosx delete
package SUNWmctag delete
package SUNWosdem delete
package SUNWpdas delete
package SUNWrmwbr delete
package SUNWrmwbu delete
package SUNWsra delete
package SUNWsrh delete
package SUNWtnamd delete
package SUNWtnamr delete
package SUNWtnetd delete
package SUNWtnetr delete
package SUNWwbpro delete
package SUNWwebminr delete
package SUNWwebminu delete
package SUNWxorg-compatlinks delete
package SUNWxwslb delete
package SUNWzfsgr delete
package SUNWzfsgu delete
Actually, there's a little bit missing from the above, which is what another new subcommand - missingpackages - will show, namely the list of packages that should be installed to meet dependency requirements but aren't:
# ./solview missingpackages
missing package SUNW5xmft needed by [SUNW5xfnt, SUNWjxplt, SUNWhkfnt]
missing package SUNWcxmft needed by [SUNWcxfnt, SUNWcscgu, SUNWjxplt]
missing package SUNWfsmgtr needed by [SUNWdmgtr, SUNWdmgtu]
missing package SUNWfsmgtu needed by [SUNWdmgtr, SUNWdmgtu]
missing package SUNWjxmft needed by [SUNWjxcft, SUNWjedt, SUNWjxplt]
missing package SUNWkxmft needed by [SUNWkuxft, SUNWjxplt]
missing package SUNWluzone needed by [SUNWzoneu]
missing package SUNWlvma needed by [SUNWlvmr, SUNWmddr]
missing package SUNWpostgr-82-client needed by [SUNWpostgr-upgrade]
missing package SUNWpostgr-82-libs needed by [SUNWpmdbdpg, SUNWpostgr-upgrade]
missing package SUNWpostgr-82-server needed by [SUNWpostgr-upgrade]
missing package SUNWwbcor needed by [SUNWdmgtu]
missing package SUNWwbcou needed by [SUNWdhcsu, SUNWdmgtu]
missing package SUNWwbpro needed by [SUNWdmgtu]
missing package SUNWzlibr needed by [openofficeorg-ure]
Now, some of those are install errors on my part (I ought to have killed all the postgres packages), but some are just due to wrong dependency data.
Continuing a bit of a theme, disks, networks interfaces, processors, packages, and clusters are sorted.
In the jumpstart profile builder there's quite a lot more polish. Version 0.52 added automatic recursive removal of packages, but the new version fixes a number of minor display issues - the checkboxes update instantly, clusters properly reflect their status if all their constituent packages are added or removed, and the profile appears automatically when you go to the profile display tab. And if you're fed up, you can start over without exiting. All in all it's now much easier to use.
JProc 0.5
I've just released version 0.5 of JProc, which allows you to access Solaris data from java applications.
I was hoping for a few more features, but encountered a fairly nasty bug, and it was more than worth fixing that straight away.
Basically, you get the data from /proc by opening files in the /proc filesystem and reading data from them. I was doing the open(), but there was a distinct lack of close() associated with each one. A massive file descriptor leak ensued.

The one neat feature that made it was the ability to select which columns are visible in the process viewer. This involved a little fiddling with the Model underlying the JTable. Essentially, all I had to do was add an array of visible columns, each element of which maps to a real column. So I can have only some of the columns visible, and could re-order them if that's desired. The only tricky bit I had trouble with is that I have custom renderers for some of the columns (so that times and sizes are shown in human-friendly terms), and fiddling with the columns completely lost the custom renderers, forcing me to have to re-apply the renderers any time I change the structure.
I've hidden a few of the less commonly used columns by default, which helps by making the viewer less cluttered. There's still room for improvement, especially in the area of aggregation and filtering - areas where top and prstat are so-so.
I was hoping for a few more features, but encountered a fairly nasty bug, and it was more than worth fixing that straight away.
Basically, you get the data from /proc by opening files in the /proc filesystem and reading data from them. I was doing the open(), but there was a distinct lack of close() associated with each one. A massive file descriptor leak ensued.
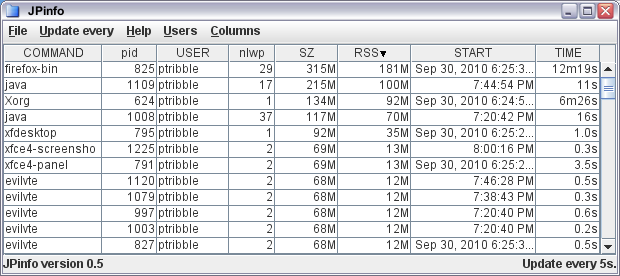
The one neat feature that made it was the ability to select which columns are visible in the process viewer. This involved a little fiddling with the Model underlying the JTable. Essentially, all I had to do was add an array of visible columns, each element of which maps to a real column. So I can have only some of the columns visible, and could re-order them if that's desired. The only tricky bit I had trouble with is that I have custom renderers for some of the columns (so that times and sizes are shown in human-friendly terms), and fiddling with the columns completely lost the custom renderers, forcing me to have to re-apply the renderers any time I change the structure.
I've hidden a few of the less commonly used columns by default, which helps by making the viewer less cluttered. There's still room for improvement, especially in the area of aggregation and filtering - areas where top and prstat are so-so.
Monday, September 06, 2010
KAR 0.4
The latest release of KAR, the Kstat Activity Reporter, is now available.
This version adds a couple of extra features:
The graphs subcommand will generate a bunch of useful png graphs for a given input file. Currently, I generate basic graphs for cpu utilization (user/kernel/idle for the whole system and for each cpu), I/O, and network statistics.
I've also added a simple browser, which looks for kar output files and lets you load them into either the kstat browser or chart builder from JKstat.
Oh, and in line with some of the other work I've been doing recently, most of the output is sorted correctly.
This version adds a couple of extra features:
The graphs subcommand will generate a bunch of useful png graphs for a given input file. Currently, I generate basic graphs for cpu utilization (user/kernel/idle for the whole system and for each cpu), I/O, and network statistics.
I've also added a simple browser, which looks for kar output files and lets you load them into either the kstat browser or chart builder from JKstat.
Oh, and in line with some of the other work I've been doing recently, most of the output is sorted correctly.
Sunday, September 05, 2010
JKstat 0.41
Updated versions of JKstat are coming out more frequently than I would like at the moment. I think I'm done and move on to something else and find I need to add some new feature.
Having just finished 0.40, which implemented Comparable to make sorting easier, I went through more of the code - including the demos included, and those in SolView - to look at how they sorted (or, in some cases, failed to sort where they should have) their output. This led me to make a slight change to the jkstat api, which cleaned up a little of the code.
The data stored by a Kstat is a simple key-value hash.The original implementation exposed this internal data structure - you simply got access to the internal Java
This version also includes a couple of samples using JStripChart, as shown in an earlier blog entry
Having just finished 0.40, which implemented Comparable to make sorting easier, I went through more of the code - including the demos included, and those in SolView - to look at how they sorted (or, in some cases, failed to sort where they should have) their output. This led me to make a slight change to the jkstat api, which cleaned up a little of the code.
The data stored by a Kstat is a simple key-value hash.The original implementation exposed this internal data structure - you simply got access to the internal Java
Map. This always felt slightly ugly, exposing internal implementation details. So that's been changed. There's a new Kstat.statistics() method, which simply returns a Set of the statistic names. This is really what clients want, rather than getting the hash and getting its keys, which is what they did before. Furthermore, in almost every case you want the list of statistic names to be sorted, so rather than everyone getting the list and sorting it themselves, it's backed by a TreeSet and is already sorted. The original getMap() method is gone. Removed. That's why we're not yet at version 1.This version also includes a couple of samples using JStripChart, as shown in an earlier blog entry
Wednesday, September 01, 2010
Simple Java strip charts
I've been looking for a very simple Java strip chart for a while, and haven't found one. So in the end I decided to put together something myself, the end result being JStripChart.
(There's already something else out there called jstripchart. Just to confuse you, it's a python implementation.)
Using JKstat to knock something together I came up with this:

Of course, you partly miss the point which is that this thing is merrily scrolling away.
I expect to be able to use this fairly extensively in both JKstat and SolView, but it's certainly not tied to those in any way - it's designed to be trivially simple to use in any context.
The API really is very simple. Just create a chart:
which you can add to your application in the normal way as it's just a
will add the value
(There's already something else out there called jstripchart. Just to confuse you, it's a python implementation.)
Using JKstat to knock something together I came up with this:

Of course, you partly miss the point which is that this thing is merrily scrolling away.
I expect to be able to use this fairly extensively in both JKstat and SolView, but it's certainly not tied to those in any way - it's designed to be trivially simple to use in any context.
The API really is very simple. Just create a chart:
JStripChart jsc = new JStripChart();
which you can add to your application in the normal way as it's just a
JPanel, and then
jsc.add(some_data);
will add the value
some_data to the right of the chart and move everything else along. That's it. (To get it to continuously update, create a Timer loop.)
Monday, August 30, 2010
New SolView
I've just released a new version of SolView. This version cleans up the code used to display SVR4 packaging, and makes a couple of improvements to the Jumpstart profile builder.
Nothing earth-shattering, but I made the list of packages and clusters sorted, which makes it a lot easier to find things. And, to make that less necessary, I implemented recursive removal of packages: if you remove a package, it removes anything that depends on that package as well, keeping the package dependency graph self-consistent.
There are various ways to make sorting work, and I had put together a couple of Comparator classes before doing it properly. The proper way is just to
Once Comparable is implemented, then all I need to do is replace
Of course, there's no point in learning something like this and then only using it the once. So there's a new version of JKstat in which the
Nothing earth-shattering, but I made the list of packages and clusters sorted, which makes it a lot easier to find things. And, to make that less necessary, I implemented recursive removal of packages: if you remove a package, it removes anything that depends on that package as well, keeping the package dependency graph self-consistent.
There are various ways to make sorting work, and I had put together a couple of Comparator classes before doing it properly. The proper way is just to
implement Comparable in the classes that need sorting. And in most cases the actual comparison is trivial - we're just comparing the name, which is just a String. (For patches it's a 2-stage numerical comparison of the patch id and revision, but still simple.)Once Comparable is implemented, then all I need to do is replace
Set with TreeSet and everything sorts. Simple, obvious, and something I should have done much earlier.Of course, there's no point in learning something like this and then only using it the once. So there's a new version of JKstat in which the
Kstat class implements Comparable, which immediately gets the output from some of the JKstat demos sorted. (And sorted correctly - there is a specific Comparator in use here, to sort names like sd0 which contain numbers correctly: the numerical part is sorted separately and as a number, so that sd2 comes before sd10.)
Saturday, August 21, 2010
Which snmp on Solaris?
I've just updated Jangle, my java based snmp viewer. Just a presentation tweak: the tree and list now show user-friendly names. For example, ifInOctets rather than 1.3.6.1.2.1.2.2.1.10. (Well, I find it easier to read, anyway!)
To be useful, you actually need to be running snmp on the machine you wish to monitor. Which leads me to a question: on Solaris, do you use the system supplied snmp daemon?
And if you do use the system one, is that just for convenience or do you use any of the extra functionality that it provides?
I know that I simply wipe out all the supplied snmp and sma stuff and put my own build of net-snmp in its place.
To be useful, you actually need to be running snmp on the machine you wish to monitor. Which leads me to a question: on Solaris, do you use the system supplied snmp daemon?
And if you do use the system one, is that just for convenience or do you use any of the extra functionality that it provides?
I know that I simply wipe out all the supplied snmp and sma stuff and put my own build of net-snmp in its place.
Subscribe to:
Posts (Atom)